Helping banking and finance professionals search and analyse through a highly detailed catalogue
of 18+ million structured products spanning over 79 countries.
Helping banking and finance professionals search and analyse through a highly-detailed catalogue of 18+ million structured products spanning over 79 countries.

Background
Established in 2001, SRP is a premium data intelligence subscription platform designed to meet the derivatives market's growing demand for high-quality market insights. Prestigious industry leaders, including J.P. Morgan and Goldman Sachs, are among their subscribers.
A structured product is like a bespoke tailored suit of the finance world. It is a pre-packaged financial instrument that combines multiple assets, such as derivatives and bonds, to offer customized risk and return profiles shaped to specific investor needs.
I led the end-to-end design transformation for product search and analysis, optimizing the user experience for a catalogue of over 18+ million structured products.
Problem
Over time the data had outgrown the database. Completing eight mandatory lengthy steps to search and slow loading times for results were a perfect recipe for creating frustration in users, putting the business at risk of losing subscribers. Users were also observed taking additional steps outside the platform to aggregate and calculate data results.
Solution
Designing an adaptable search and analysis solution allows users to tailor criteria to their specific needs. Grouping data and displaying the total volume, minimizes effort from users and eliminates time consuming steps in their workflow.
Designing a simple, flexible search solution that empowers users to choose their own criteria. Grouping results and displaying volume to save time and cut additional steps from the user's workload.
DESIGN IMPACT
704% increase in user engagement when creating analysis reports.
58% increase in user interaction with product search tools.
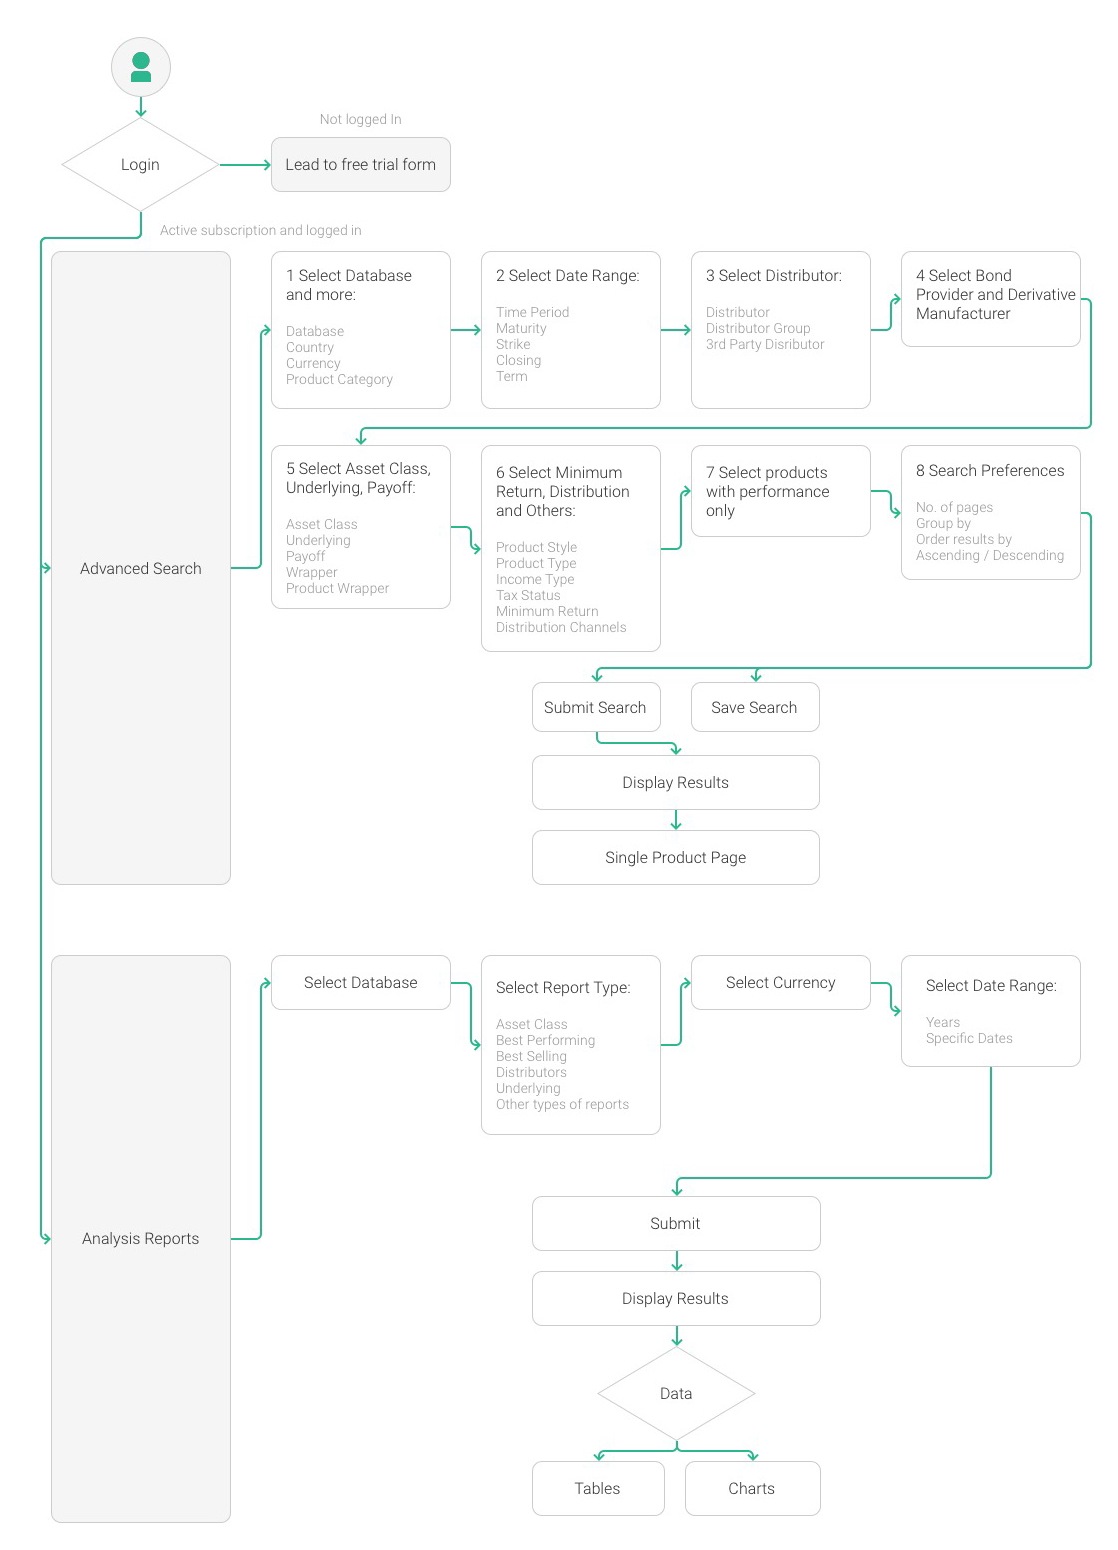
Understanding the current state searching and analysing structured products
Understanding the current state of product search and analysis reports
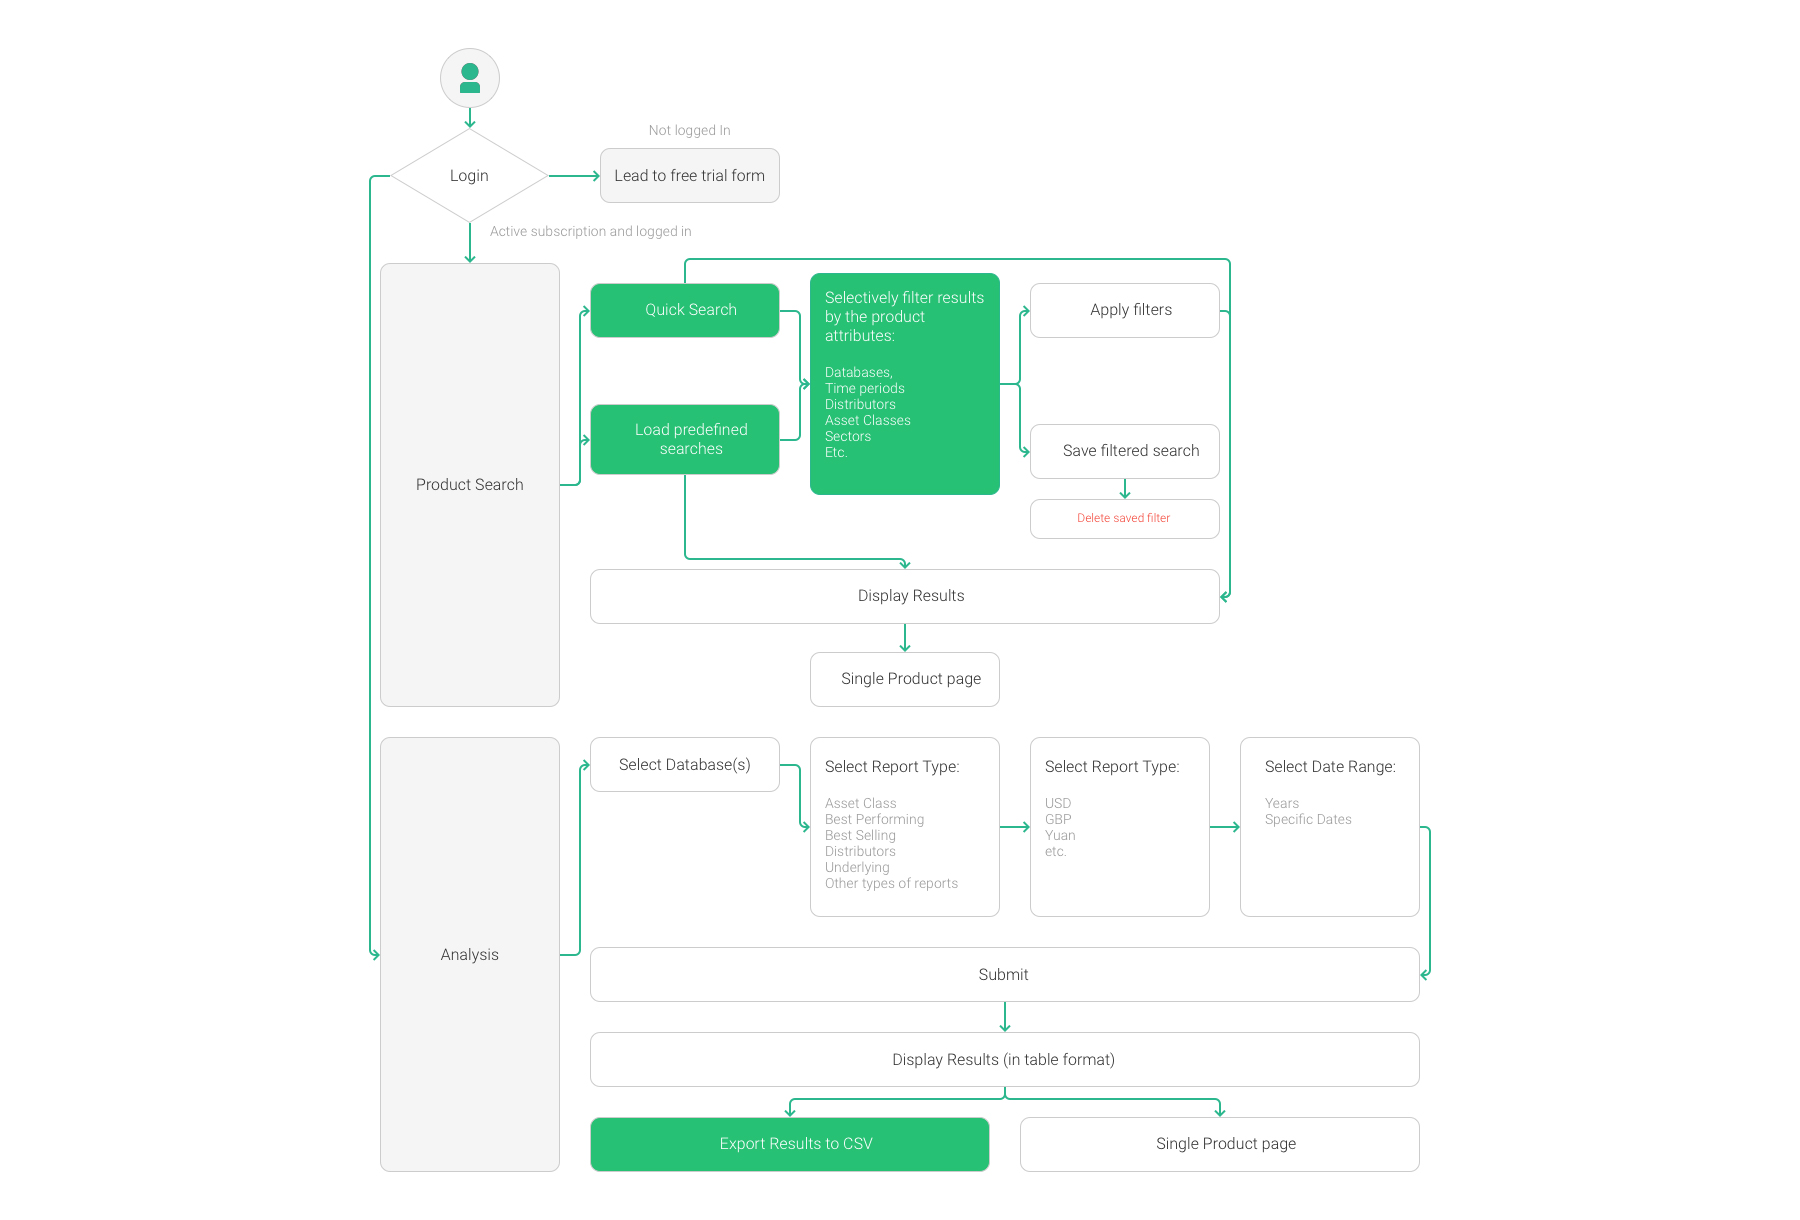
Upon the project kick-off, my first instinct was to learn as much about the existing product as possible. I spent time with key stakeholders getting to grips with the product search and analysis that led to me mapping out the existing flow.
Upon the project kick-off my first instinct was to learn much about the existing product as possible. I spent time with key stakeholders getting in grips with the product search and analysis that led to me mapping out existing flow.
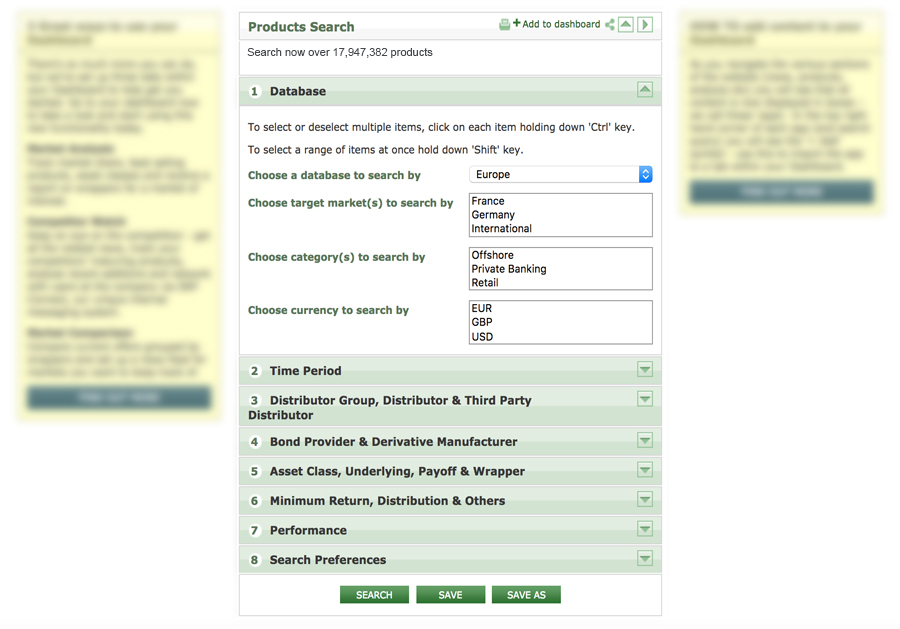
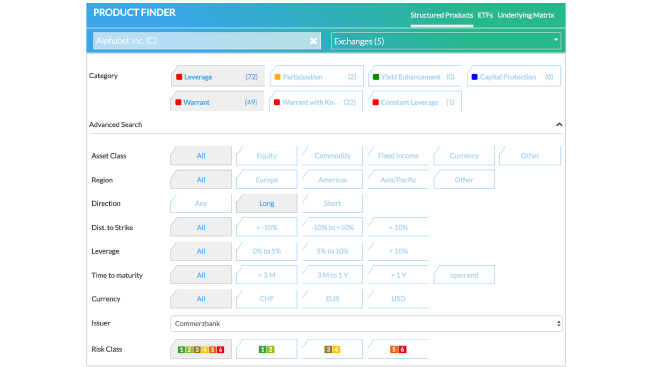
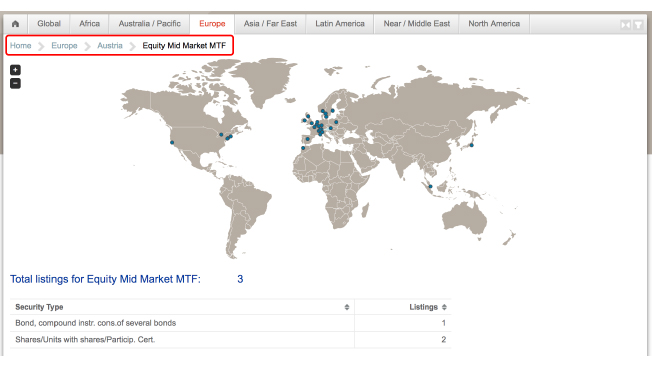
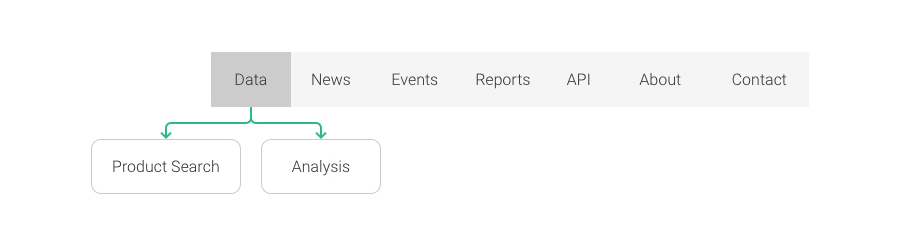
Advanced Product Search
Analysis Reports
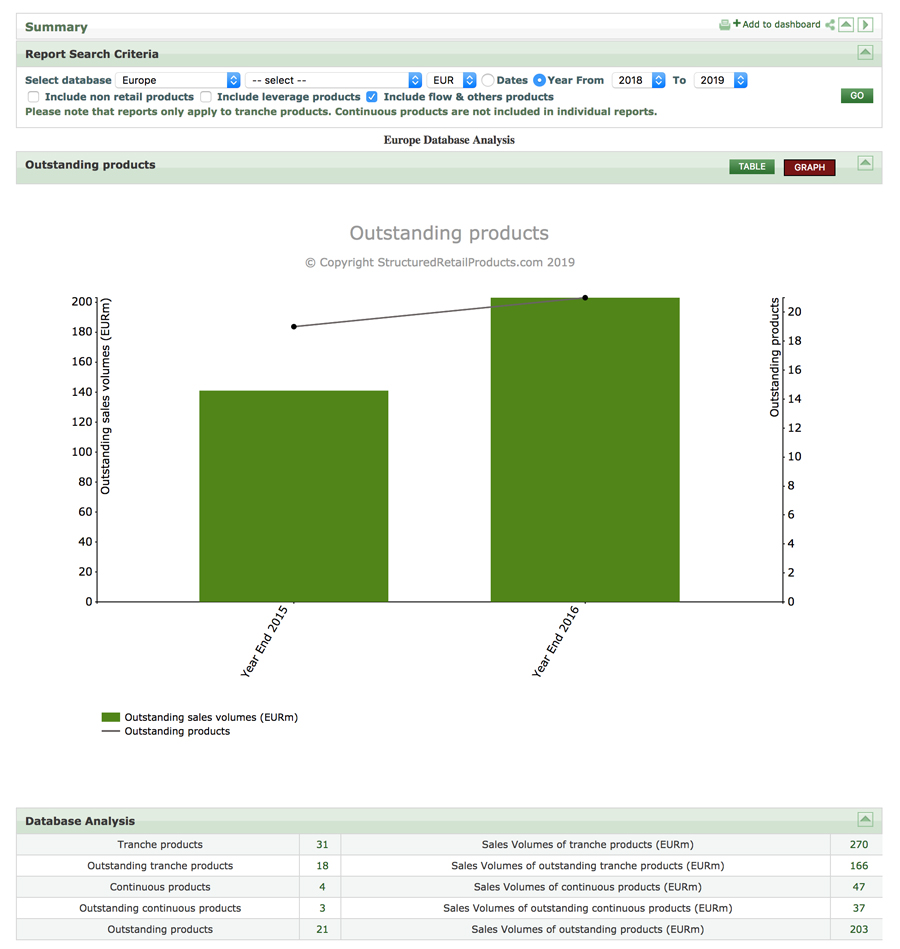
The Flow
Digging deeper and exploring the functionality and usability
I reviewed the usability to spot potential issues that would hinder the user. Below are some of my obsevations that were noted during the review.
I reviewed the usability to spot potential issues that would hinder the user. Below are some of my obsevations that were noted during the review.
Getting to know the users
I worked with SRP's Global Head of Data and Product Manager to set up feedback meetings with the clients. We devised an interview strategy and guide which would help us learn about the user's motivations, goals and pain points when interacting with the product search and analysis reports.


Upon attending the interviews, we were soon to discover the users ranged in levels of seniority and varied in knowledge of the search and analysis tools. We also learned SRP's clients were loyal to the brand and the data they provided was very important in their business functions.
We spoke with clients about their current experience with the tools, and problems they may have and also observed them interacting with the software. The interviews gave us great insights into the users' behaviour, evaluating the current usability that led to the development of the user personas.
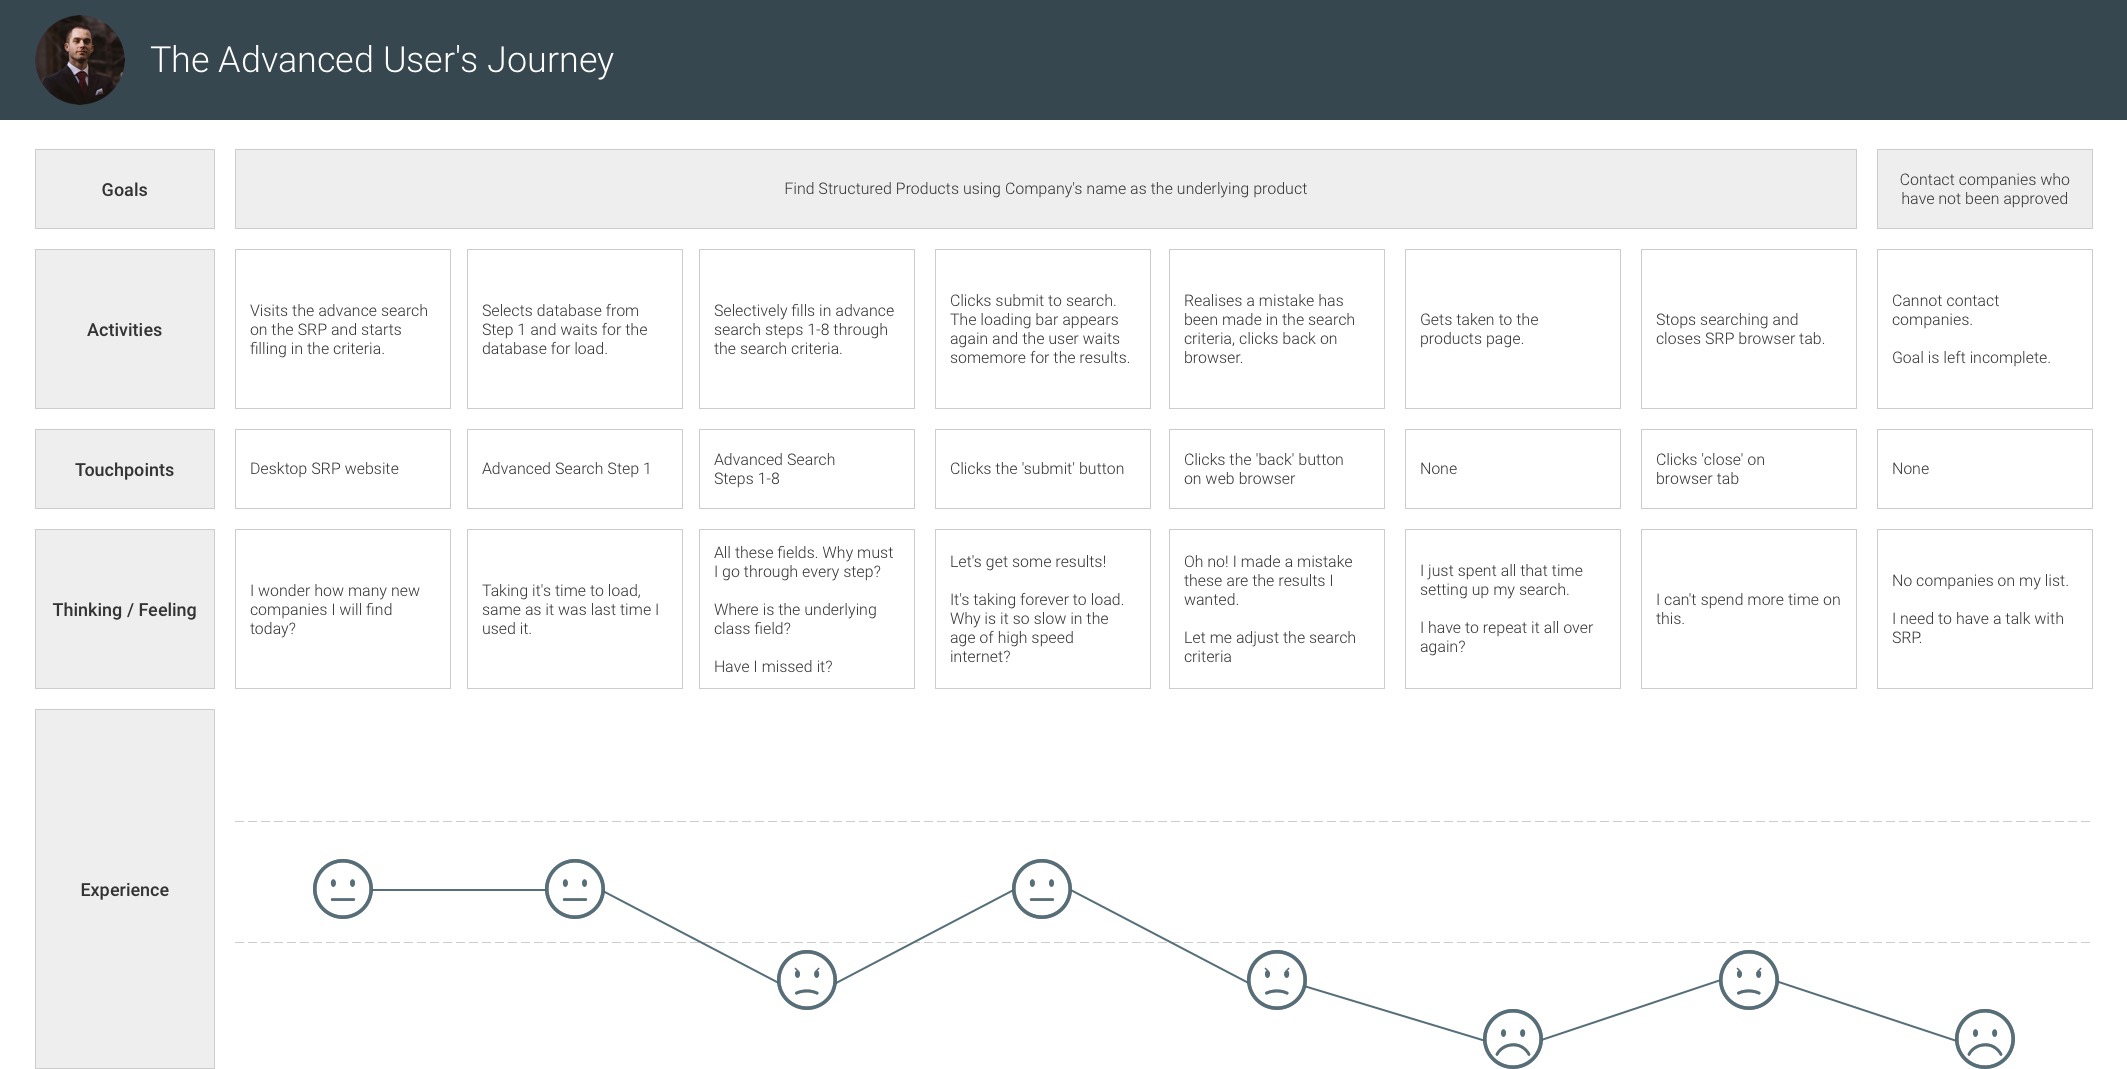
The Advanced User

"I want searching for products to be quick and flexible"
Name: Dale Müller
Age: 34
Job title: Senior Financial Reporting Analyst
Location: Great Britain
Observations
- Gets distressed with long waiting times
- Expects quality performance and service from tools
- Experience using complex functionality with a range of tools
Goals
- Compare Structured Products
- Analyse Market Data in single or across multiple markets
- Search for products using the company as the underlying asset
Pain Points
- The quick search doesn't work
- Multiple steps to fill out before completing the search
- Waiting for results to load
- Cannot aggregate results for multiple databases
Beginner to Intermediate

"Analysis reports gives me easy access to market data"
Name: Mila Ivan
Age: 27
Job title: Accounts Manager
Location: France
Observations
- Calm and patient when dealing with tedious tasks
- SRP was the only tool used to analyse Structured Products
- Numbers are more important than graphical charts
Goals
- Market research and analysis
- Presenting data to colleagues and bosses
- Career Progression
Pain Points
- Manually populating information
- Copying and Pasting data from reports into spreadsheets
- Waiting for results to load
- Cannot aggregate results for multiple databases
- Manually populating information
- Repetitive tasks
- Waiting for results to load
- Cannot aggregate results for multiple databases
"Advanced search filters can be overwhelming. I feel nervous when clicking submit because I fear something might break."
"It can take me a couple of hours at a time to copy and paste the data into my Excel records, so I can create my graphs."
"I want to be able to see the total sales volume within when the results load."
"It's clunky, nothing ever works...I don't want to talk anymore."
"Advanced search filters can be overwhelming. I feel nervous when clicking submit because I fear something might break."
"It can take me a couple of hours at a time to copy and paste the data into my excel records, so I can create my own graphs."
"It's clunky, nothing ever works...I don't want to talk anymore."
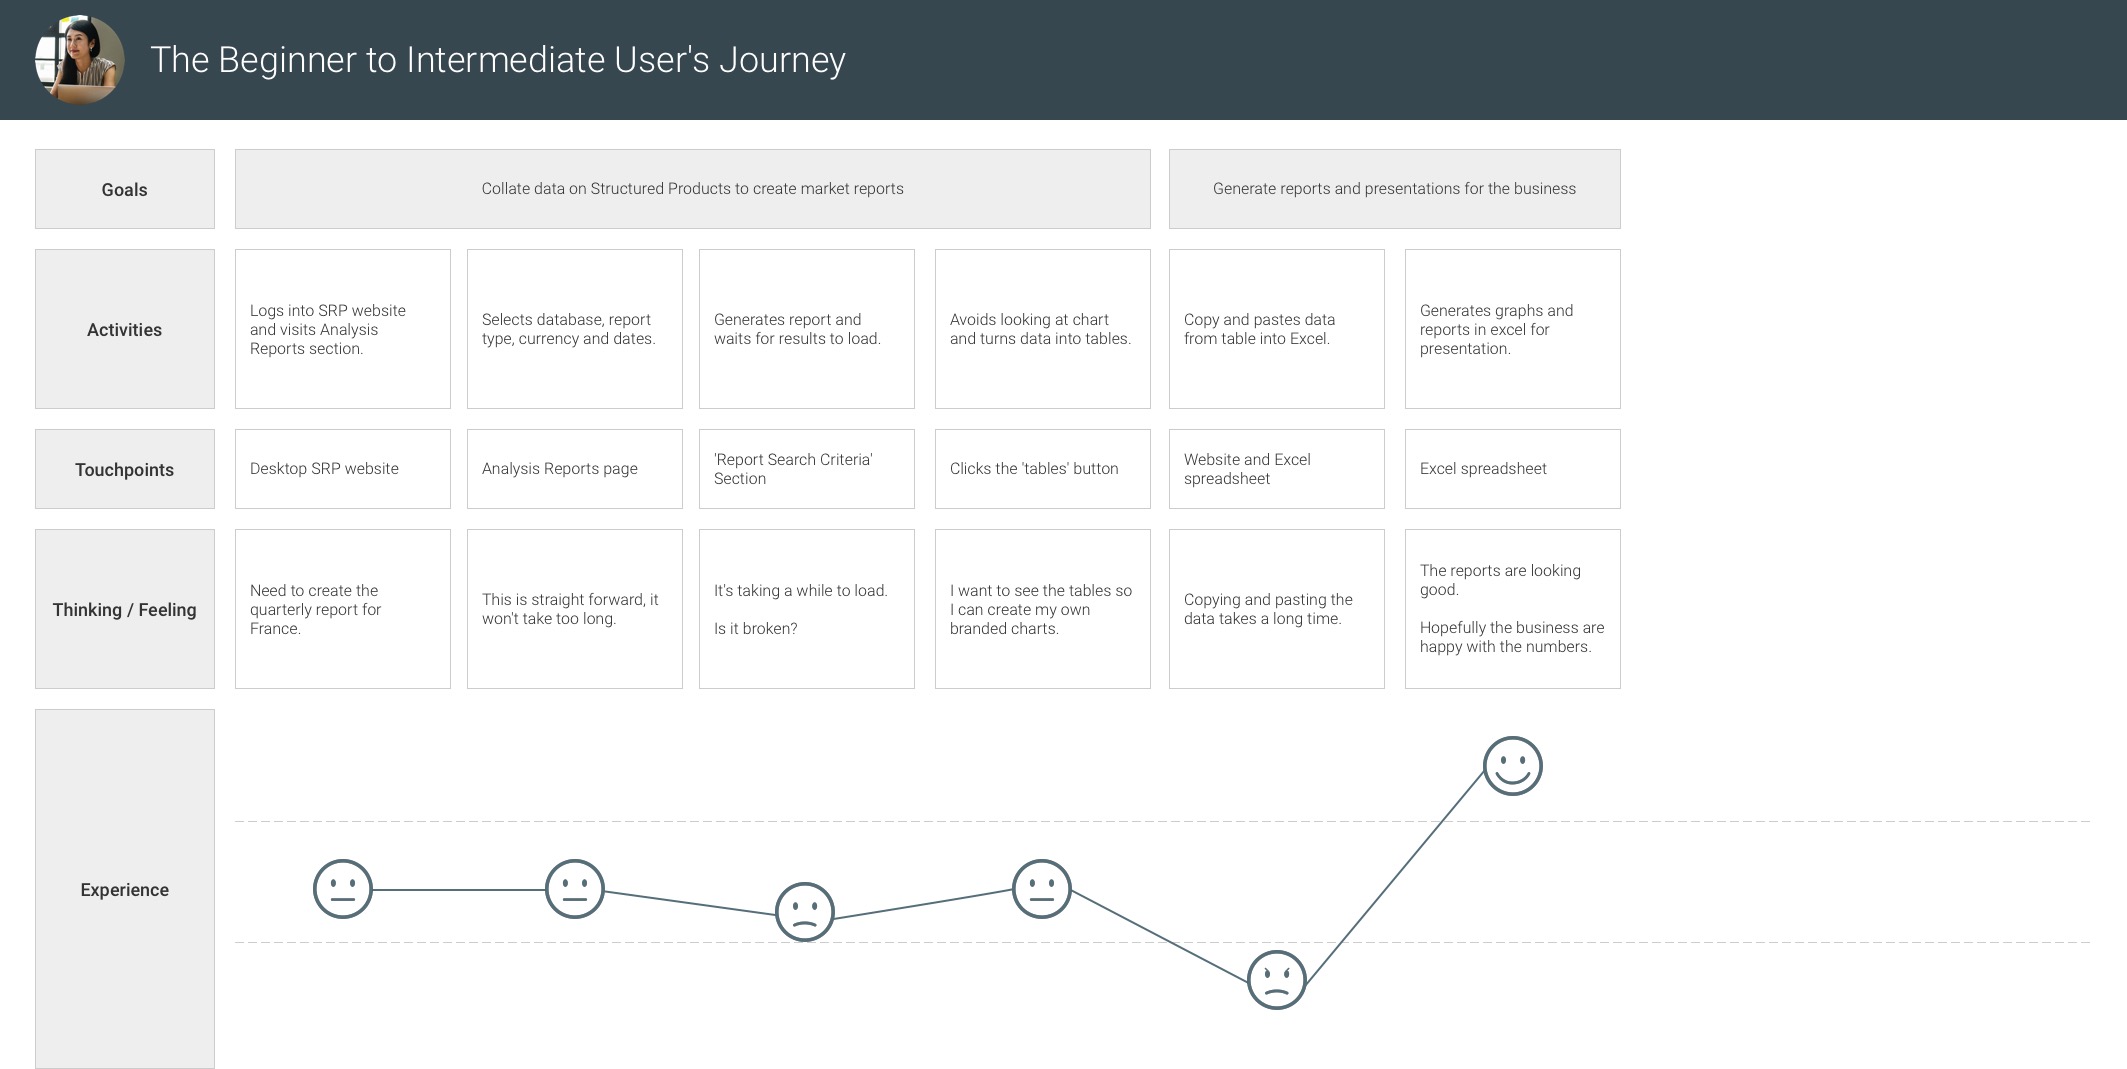
Mapping the user experience
Mapping the user experience
After collating the user feedback, I mapped out user journeys for advanced search and analysis reports. The user journey visualises the user's goals, activities, touchpoints, thoughts and experiences. The user journeys demonstrate to the stakeholders how users interact with the platform and the difficulties they encounter when trying to complete tasks.
Insights from Google Analytics
Aug 2016 - Aug 2017
- Only 3.85% of the total users interact with advanced search and analysis reports pages
- Users spend an average of 4 minutes on advanced search and analysis reports
- Primary used on desktop devices with 99% with usage on mobile being a very low 0.66%
- Only 3.85% of the total users interact with advanced search and analysis reports pages.
- Users spend an average of 4 minutes on advanced search and analysis reports.
- Primary used on desktop devices with 99% with usage on mobile being a very low 0.66%.
Measuring up against the competition
I analysed competitors in the Structured Products space to learn about different search patterns being used by the market. I also researched comparators that were known for having larges quantities of product data with a high range of filter options.
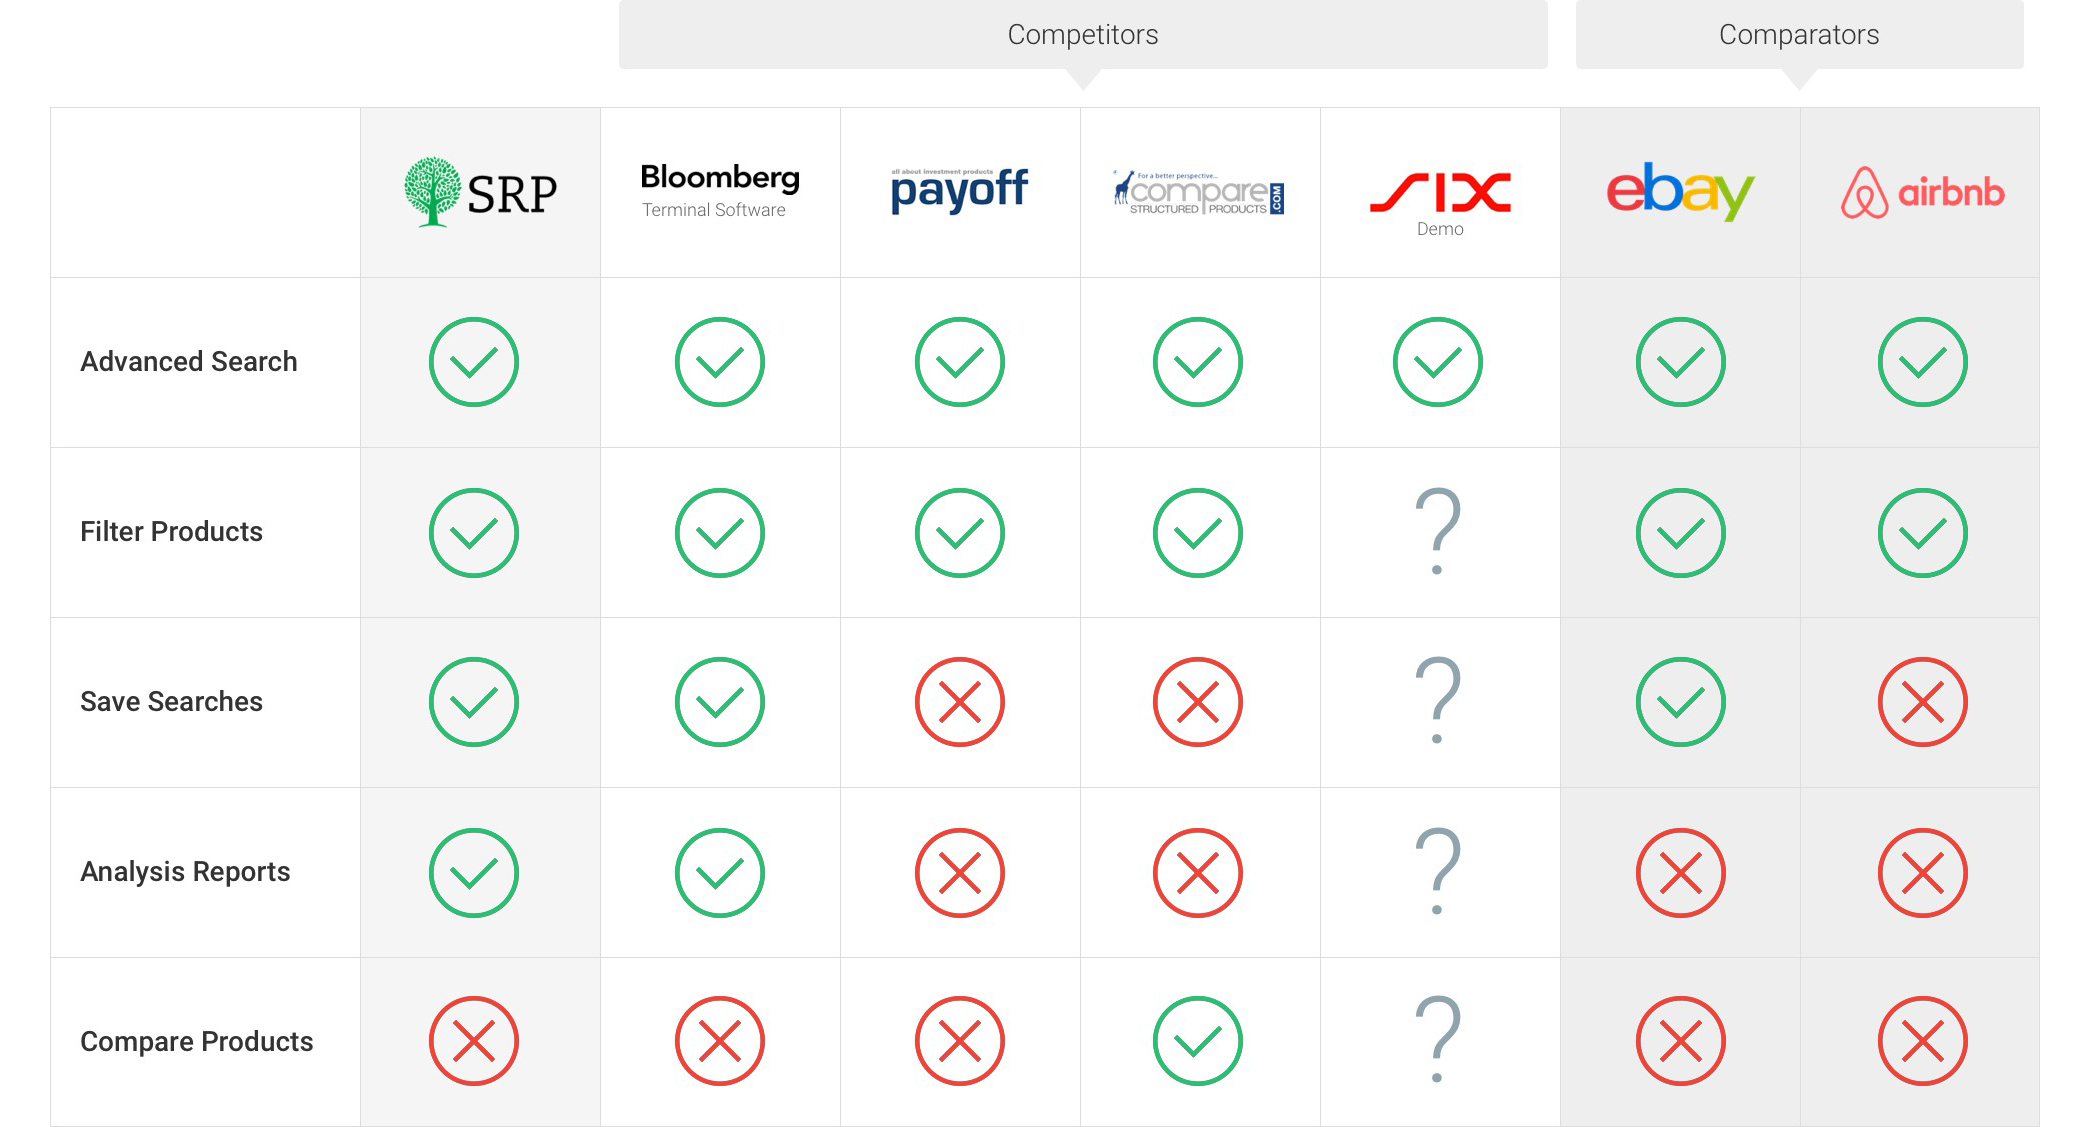
Advanced but not practical
The search is busy, there is too much information on screen. You will need training on using the software.
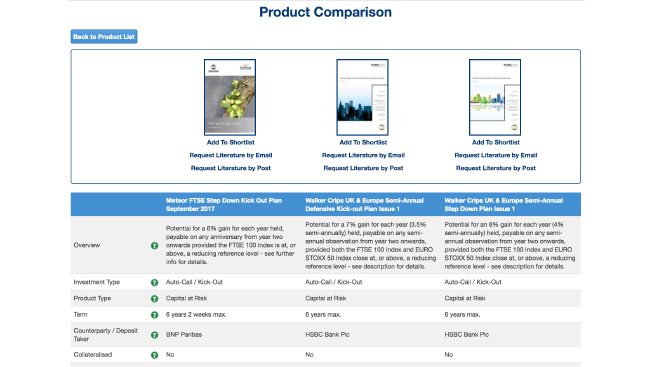
Can compare products easily
The product range is only in the hundreds but has product comparison functionality.
Limited filters
Has over 10,000 products but filters them down to a few based on search criteria.
Not enough detail
Only filters through top-level information within the trial.
None of the competitors offer a simple or flexible search solution for an expansive product catalogue.
None of the competitors offer a simple or flexible search solution for an expansive product catalogue.
Key insights into the users
SRP's quantity and quality of data is highly valued and great for creating unbiased reports.
SRP's quantity and quality of data is highly valued and great for creating unbiased reports.
SRP's quantity and quality of data is highly valued and great for creating unbiased reports.
SRP's quantity and quality of data is highly valued and great for creating unbiased reports.

Users search for live products more often than expired products.
SRP's quantity and quality of data is highly valued and great for creating unbiased reports.
Users search for live products more often than expired products.

It would be easier for users to analyse if the total volume of products sold is displayed within the product list and analysis reports tables.
SRP's quantity and quality of data is highly valued and great for creating unbiased reports.
It would be easier for users to analyse if the total volume of products sold is displayed within the product list and analysis reports tables.

Filtering by sub-groups will improve findability and save time.
SRP's quantity and quality of data is highly valued and great for creating unbiased reports.
Filtering by sub-groups will improve findability and save time.

Copying and pasting data is time consuming and laborious.
SRP's quantity and quality of data is highly valued and great for creating unbiased reports.
Copying and pasting data is time consuming and laborious.

Users are overwhelmed and can be distressed due to lengthy search steps and slow loading times.
SRP's quantity and quality of data is highly valued and great for creating unbiased reports.
Users are overwhelmed and can be distressed due to lengthy search steps and slow loading times.
How can we make analysing structured products simple, intuitive, flexible and informative?
How can we make analysing structured products simple, intuitive, flexible and informative?
How can we make analysing structured products simple, intuitive, flexible and informative?
How can we make analysing structured products simple, intuitive, flexible and informative?
Designing for simplicity
A clear journey
The architecture was restructured to create a master branch for all data. The intention was to give the user a central point to access all data features. Scalability of data functionality would be easier to access within the new structure.
Old

New
Reducing steps
By taking a filterable approach to refining products within the search, there was a significant reduction in steps.
Refined Flow
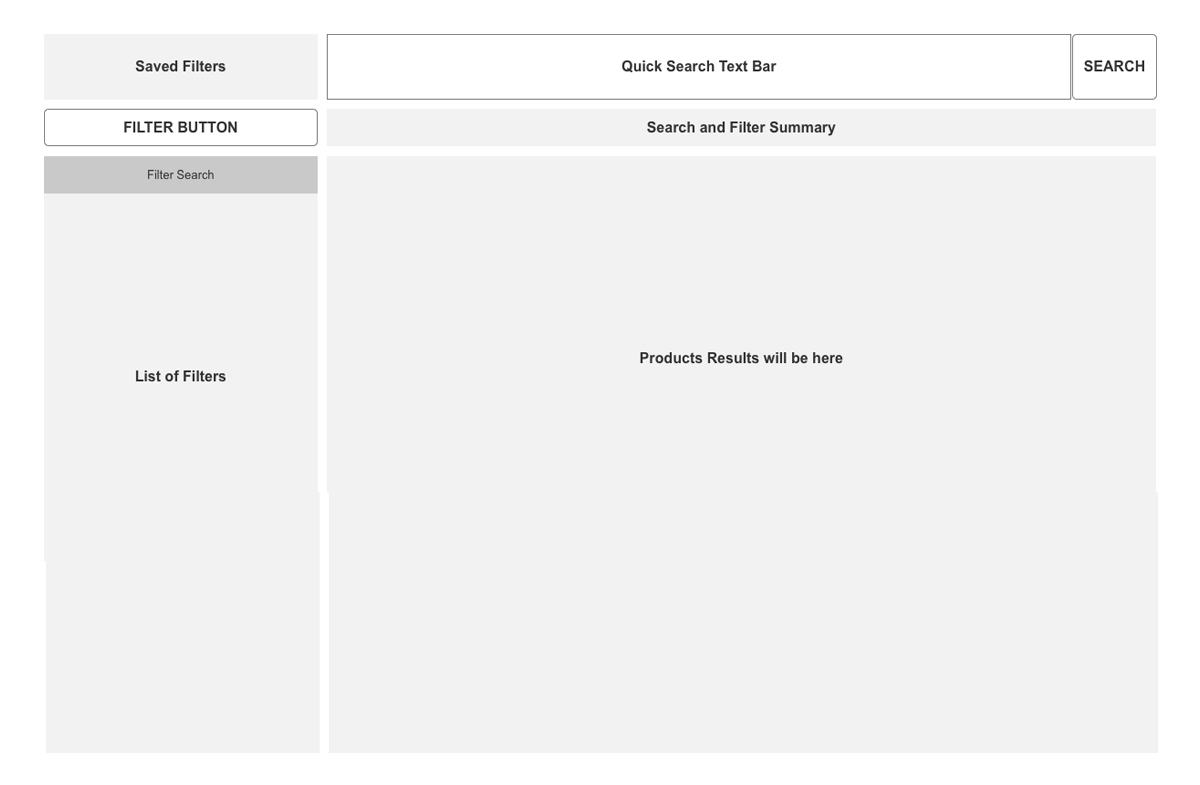
Defining space for a more intuitive user interface
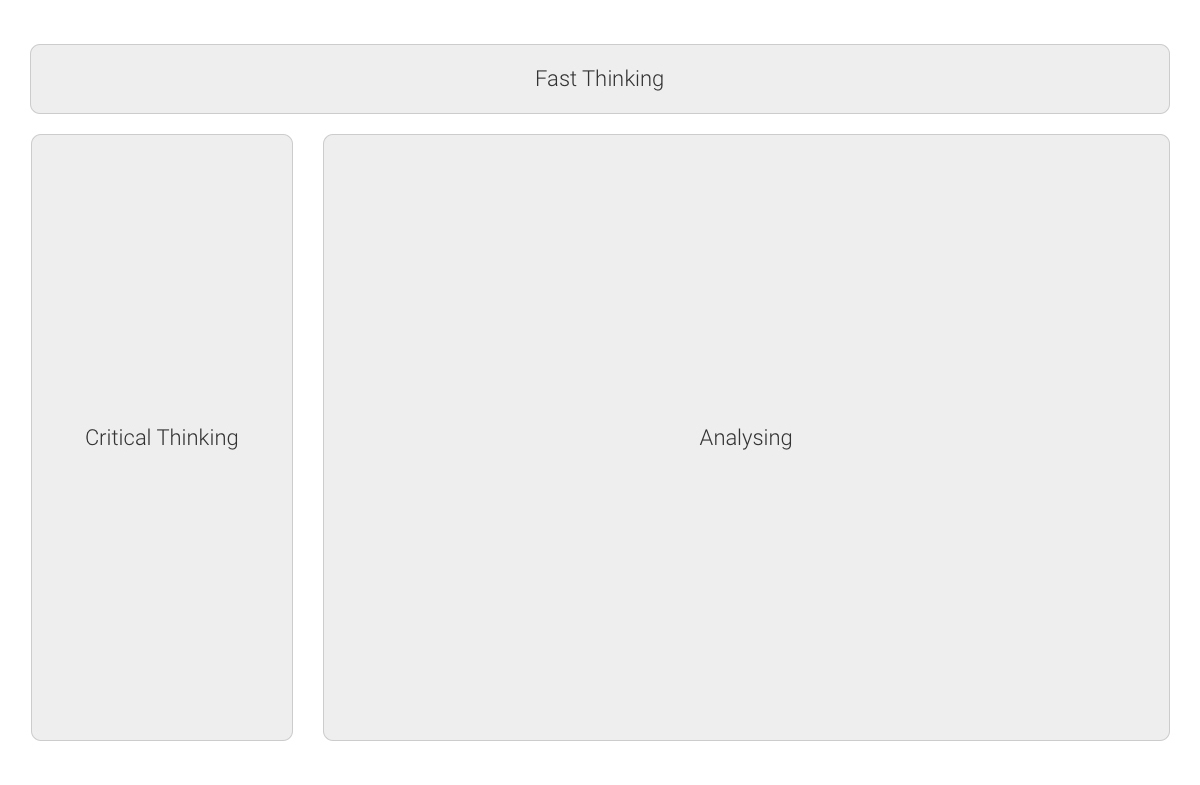
Creating division to help with decision making
To create an easy and memorable experience, I divided the pages into sections: fast thinking, critical thinking and analysing.
Defining Spaces
Structure for Product Search
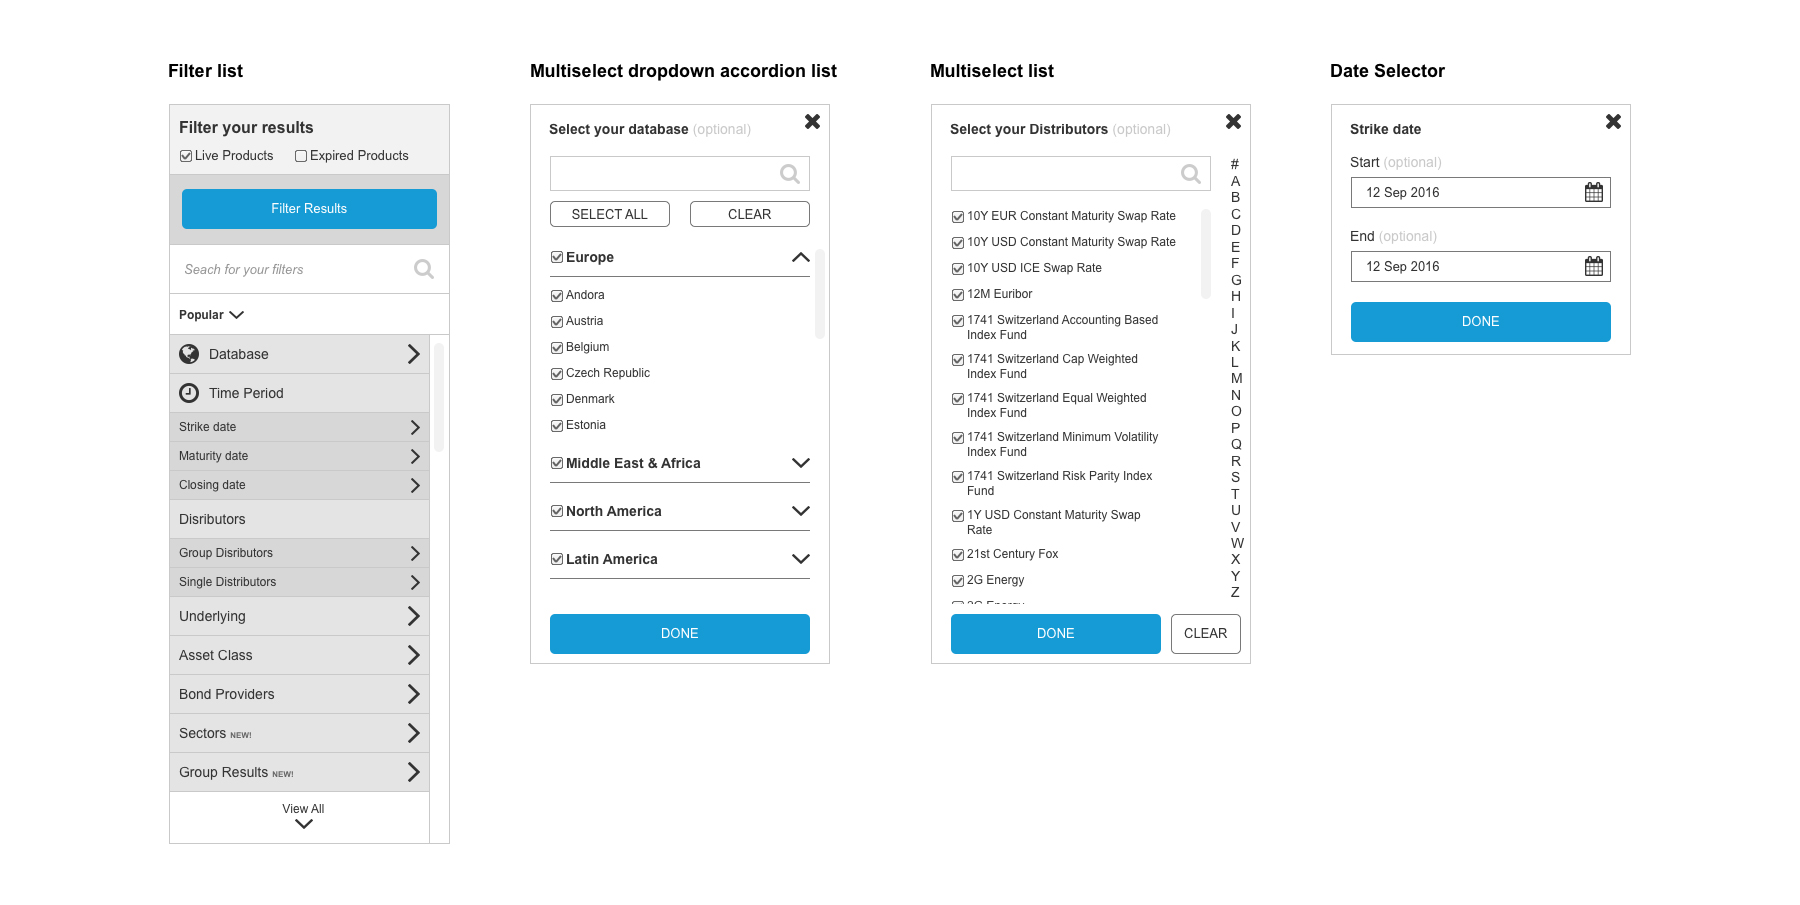
Forming patterns
I identified different types of filters and interaction points, which led me to create components and design patterns that would be reusable across a variety of filters and options. The patterns would decrease learning time when making critical decisions for analysing results and reports.
Filter Types
Styleguides and component design
Styleguides and UI elements were created a sense of consistency in the design and bring SRP's branding to the forefront.
Styleguides and UI Elements
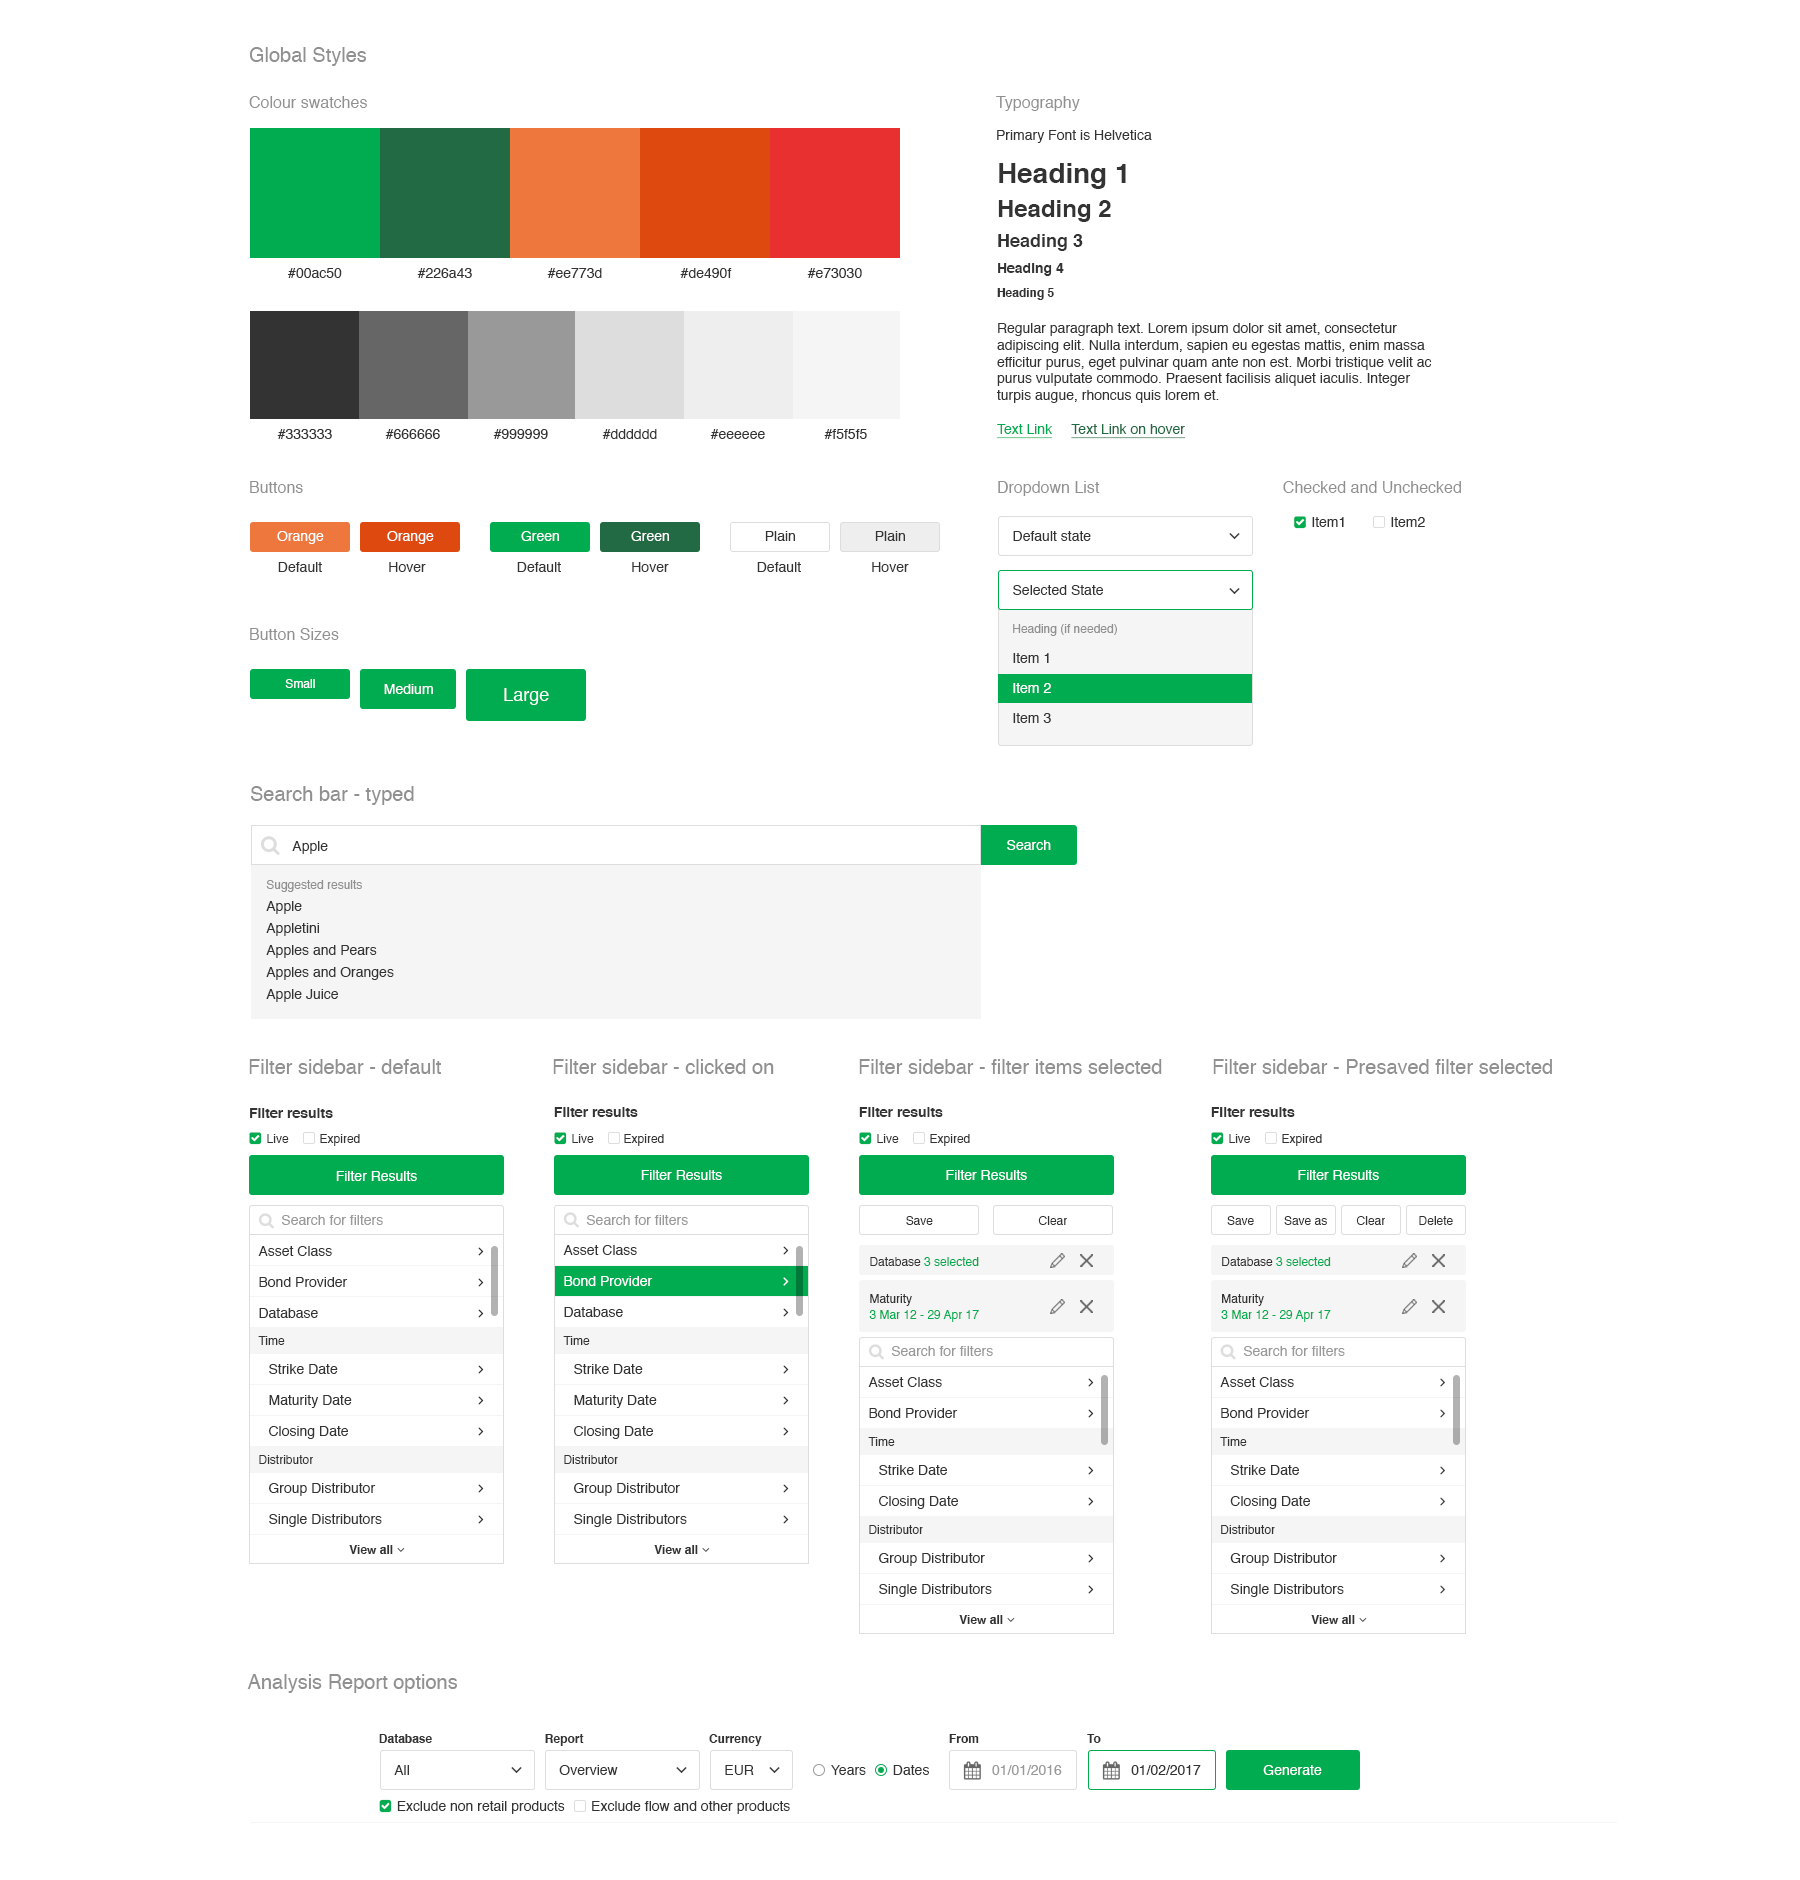
Providing feedback
To help assure users of their decisions I used micro-interactions to provide feedback.
Default State
Active Filter
Active Filter
Selected Filters
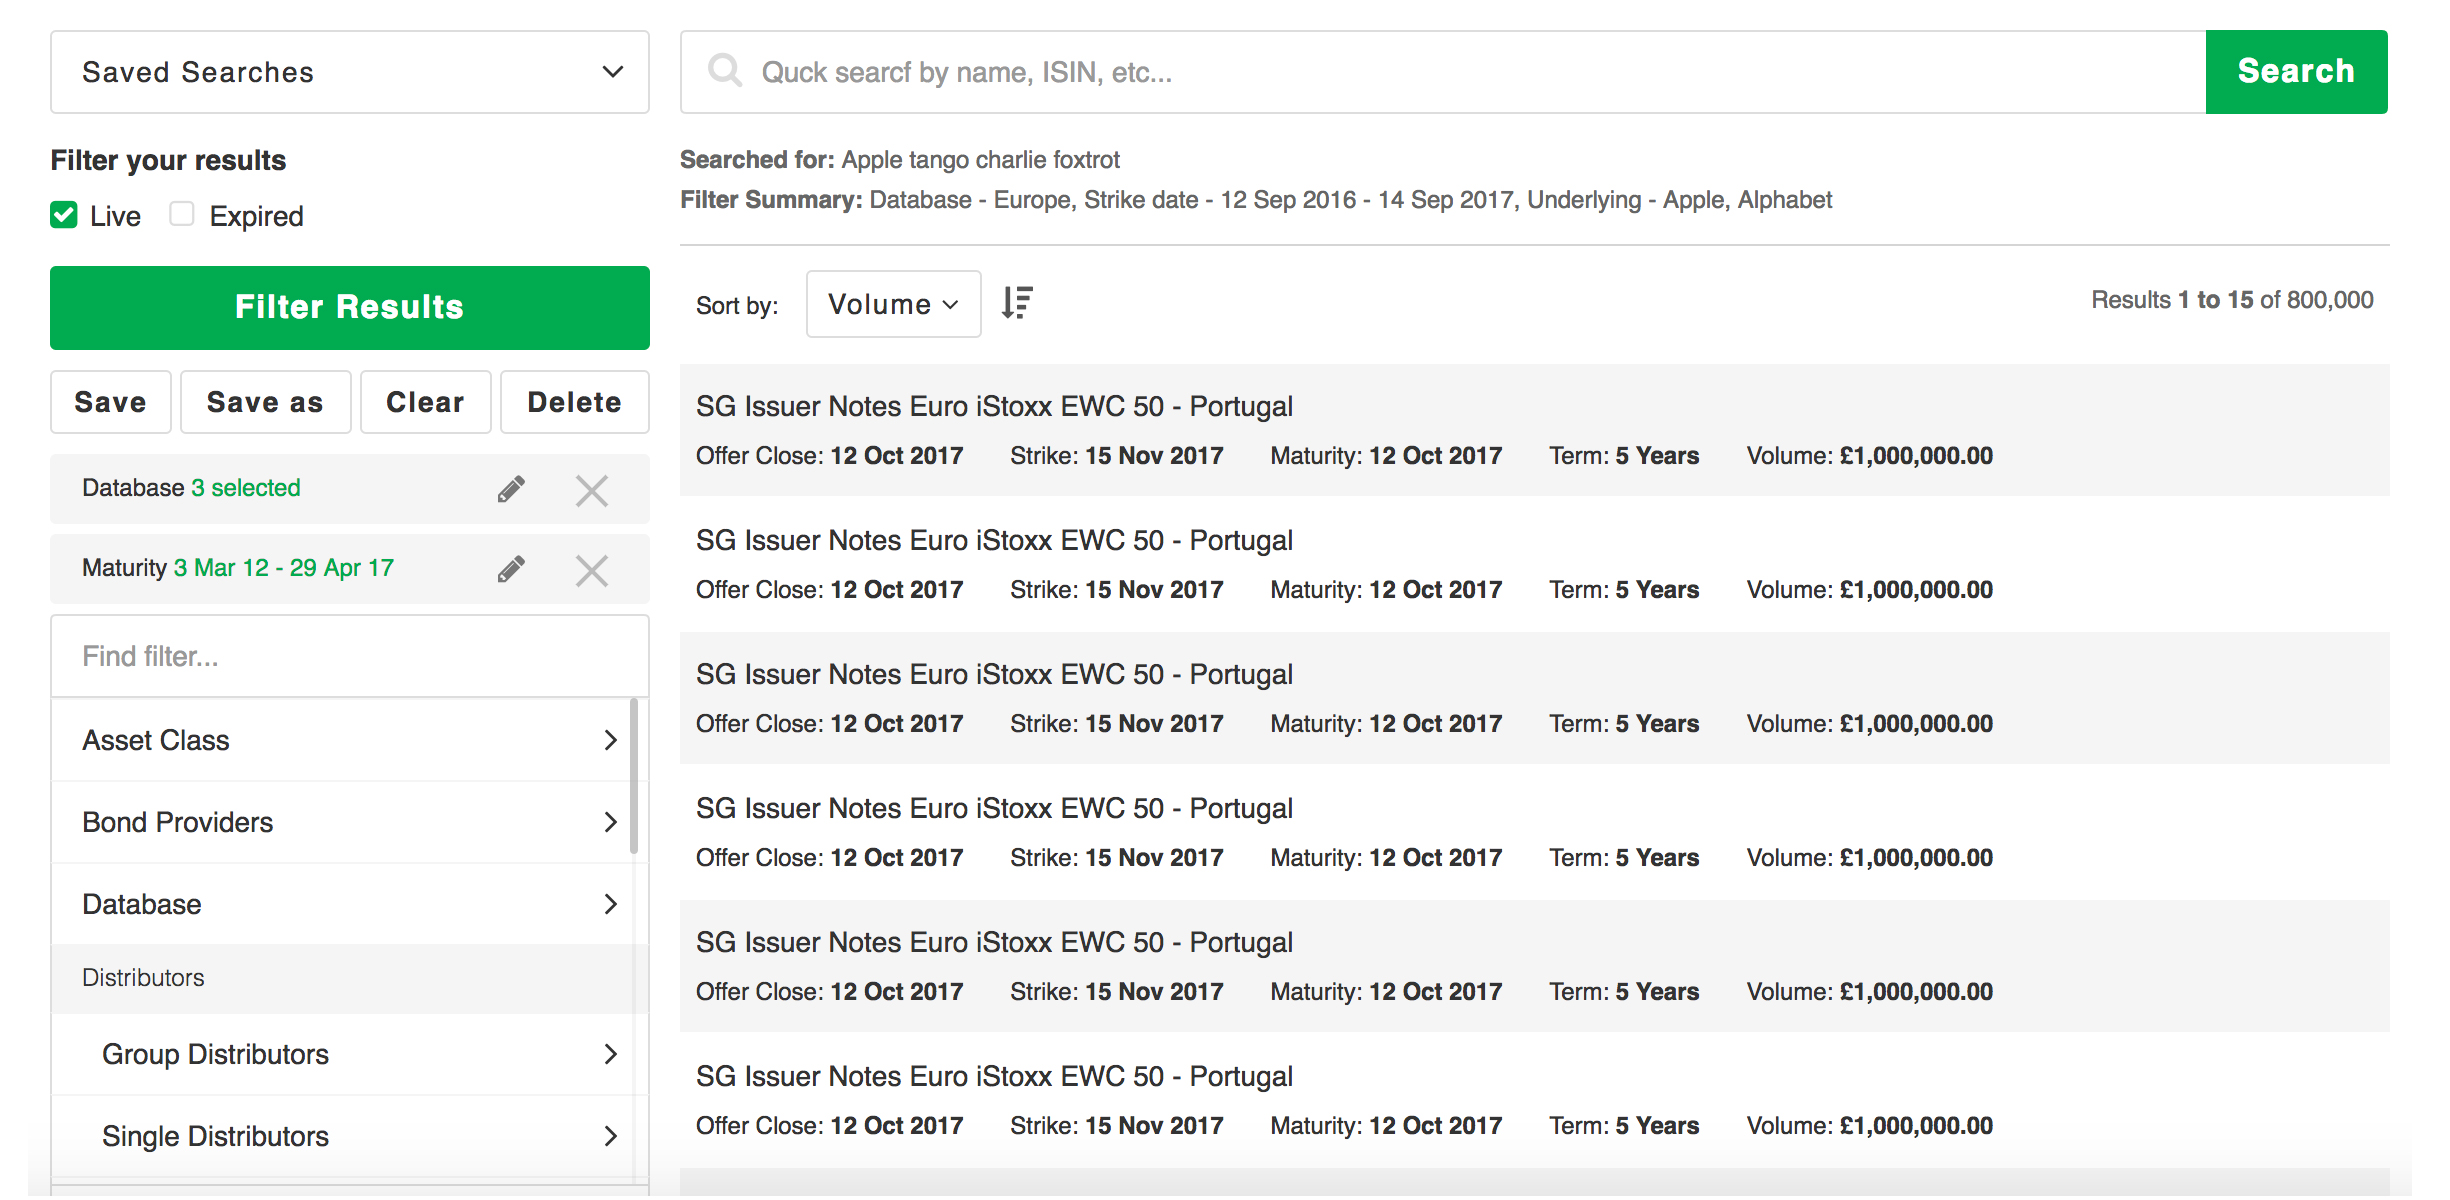
When a filter is selected, the background will fade into white to aid the user focus on the filter. To show a filter has been set there is a selected filter tab which appears above the list of filters. By clicking the pencil icon or cross the user can edit or delete the filter variable.
Loading Results
Loading bars to show the results are being generated.
Loading bars to show the results are being generated.
Giving users the flexibility to choose
Selecting multiple databases
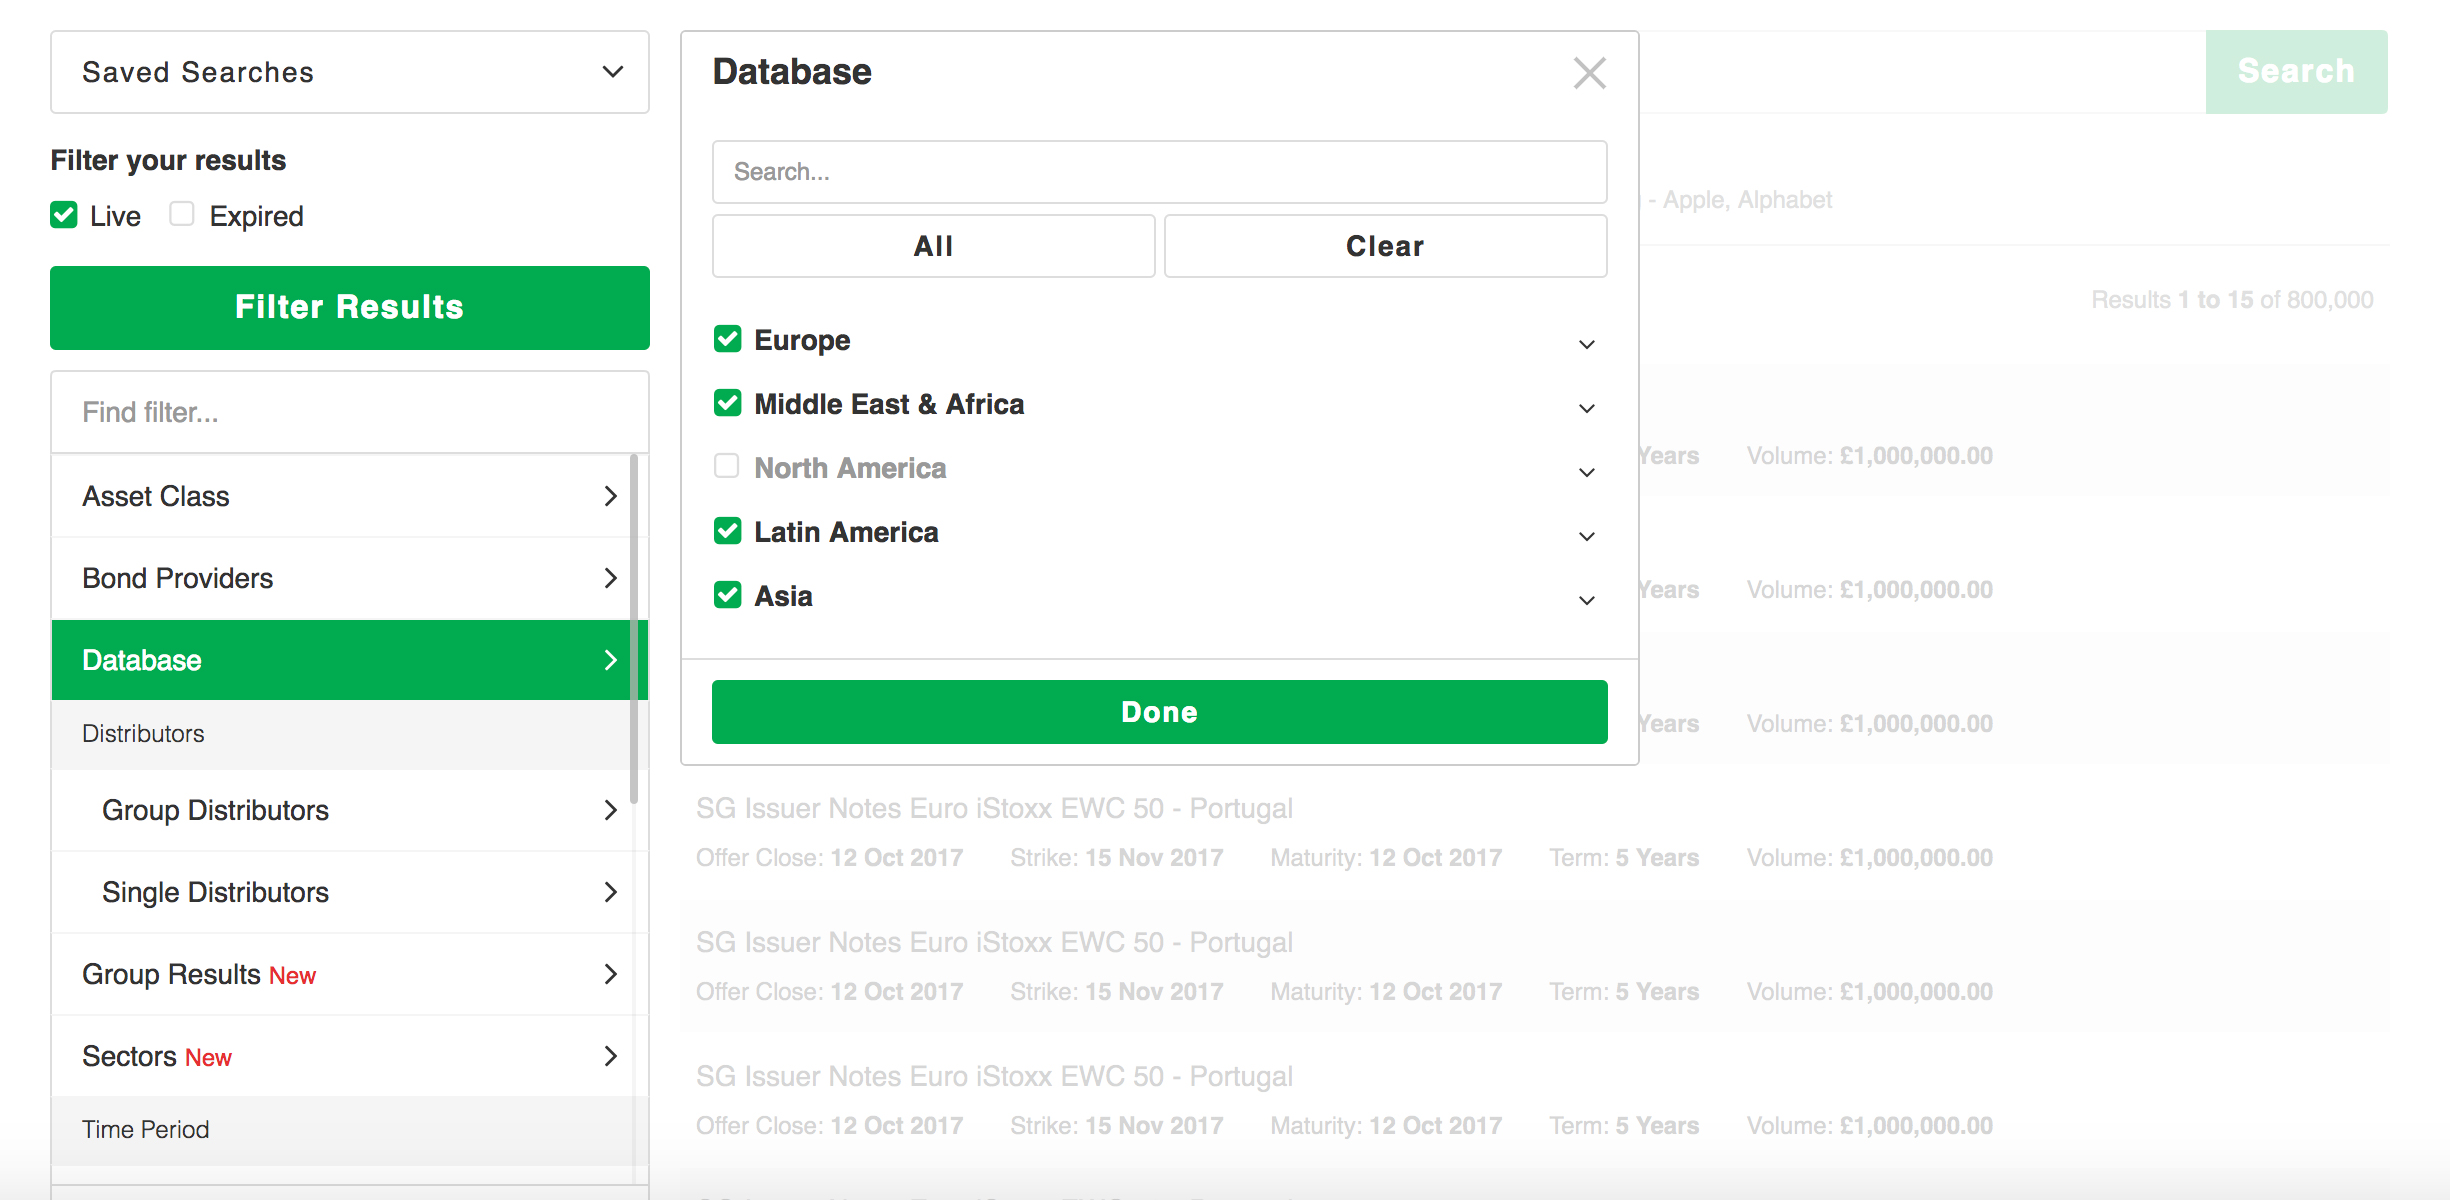
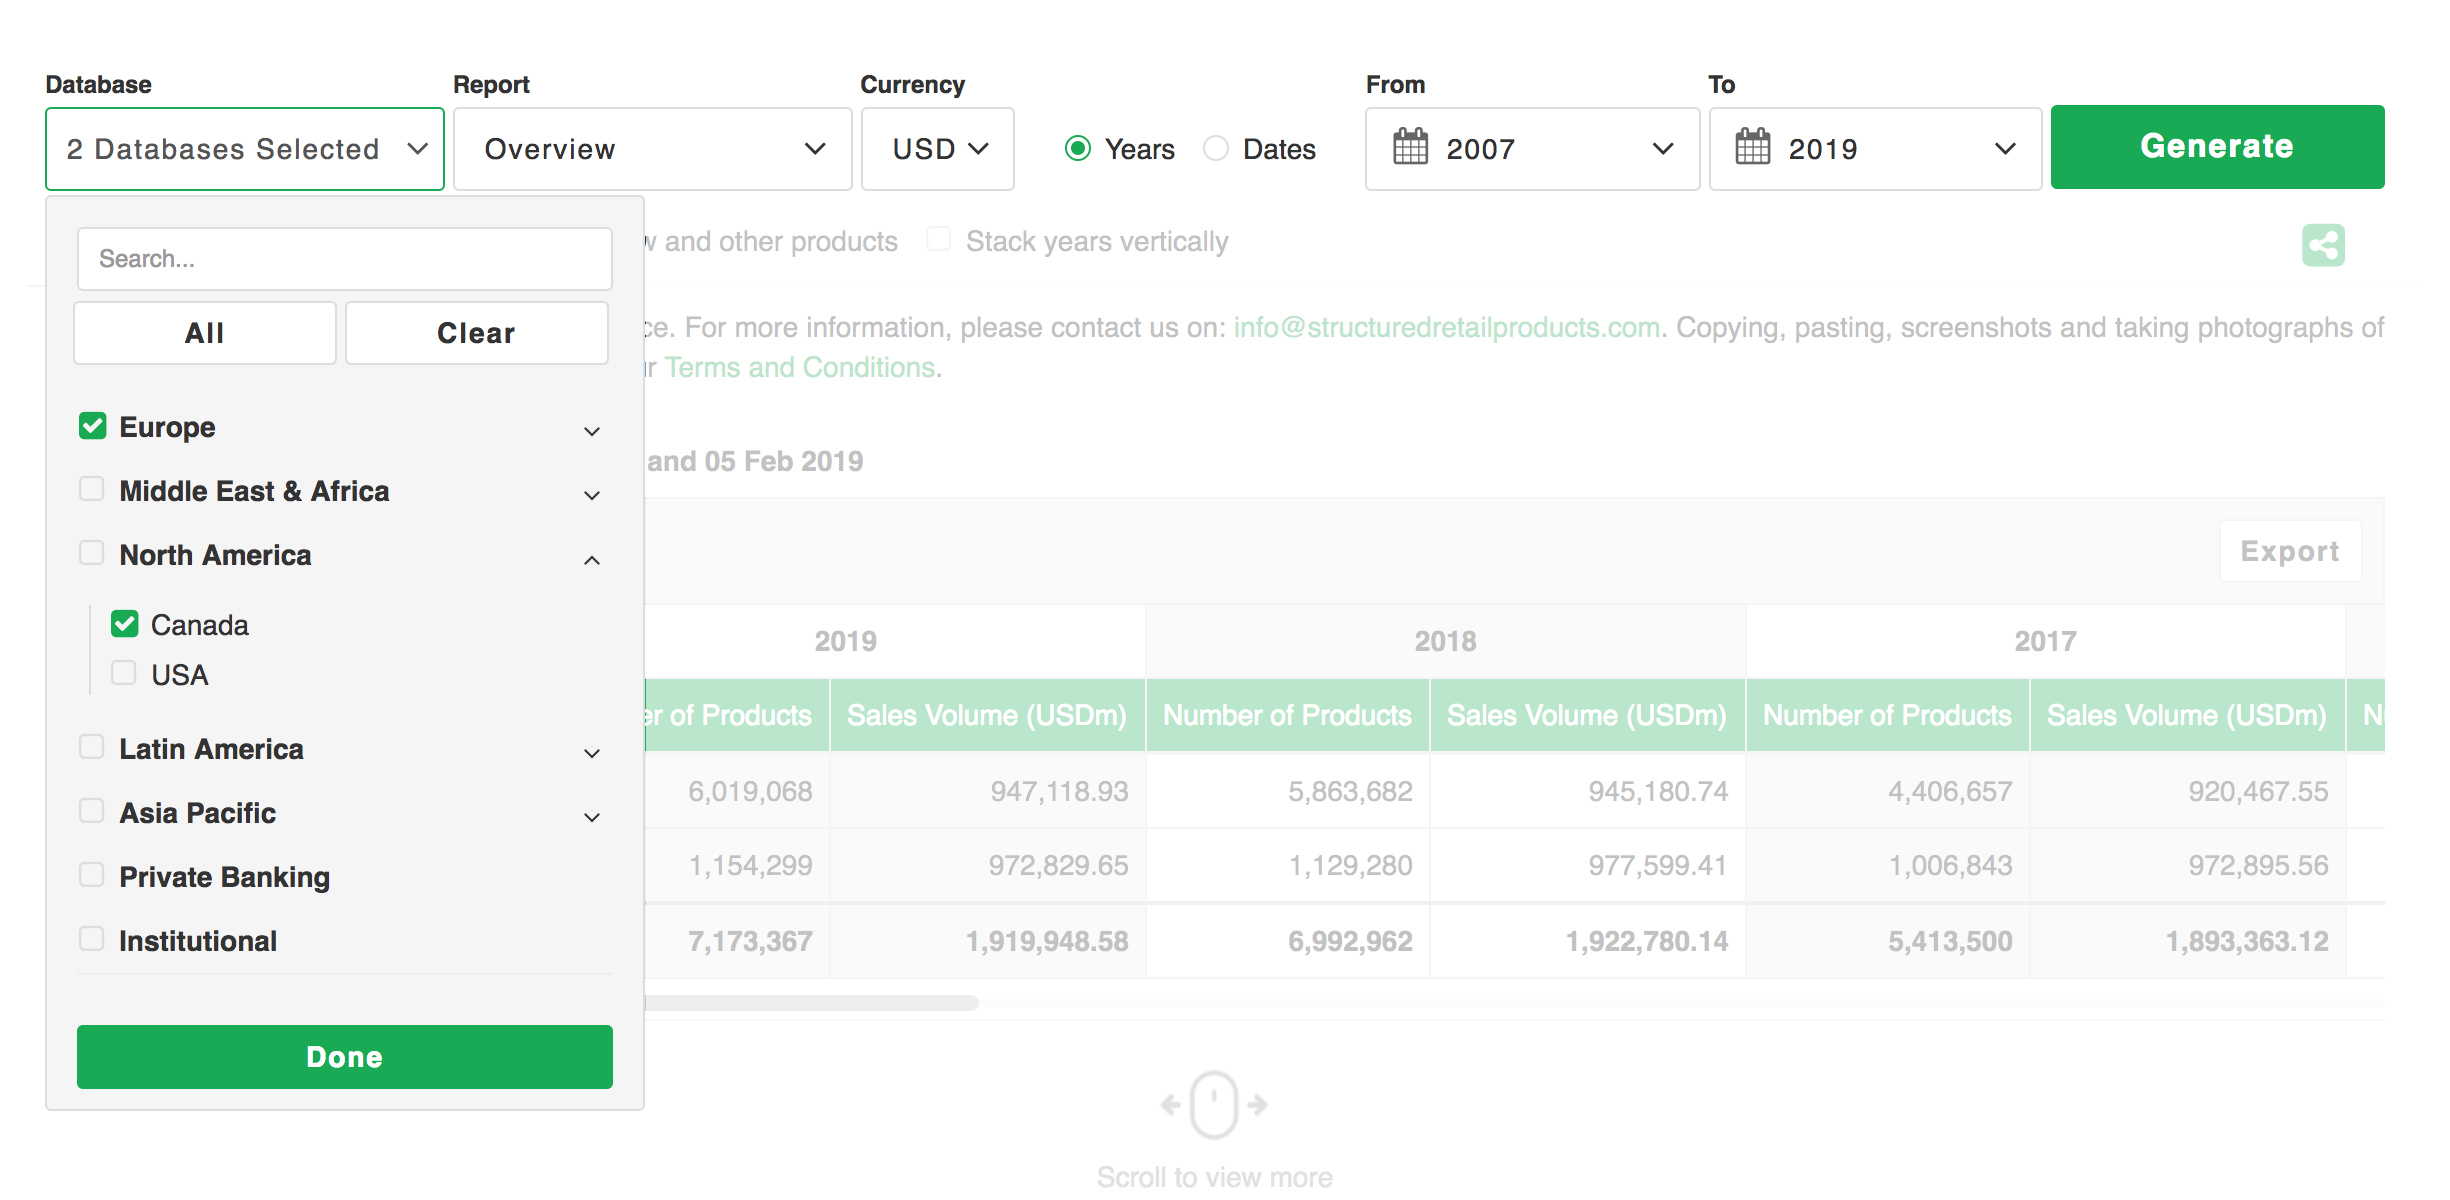
Giving the users the ability to pick and choose filters by them optional and customisable during search and analysis, created a highly flexible searching experience.
Selecting multiple databases
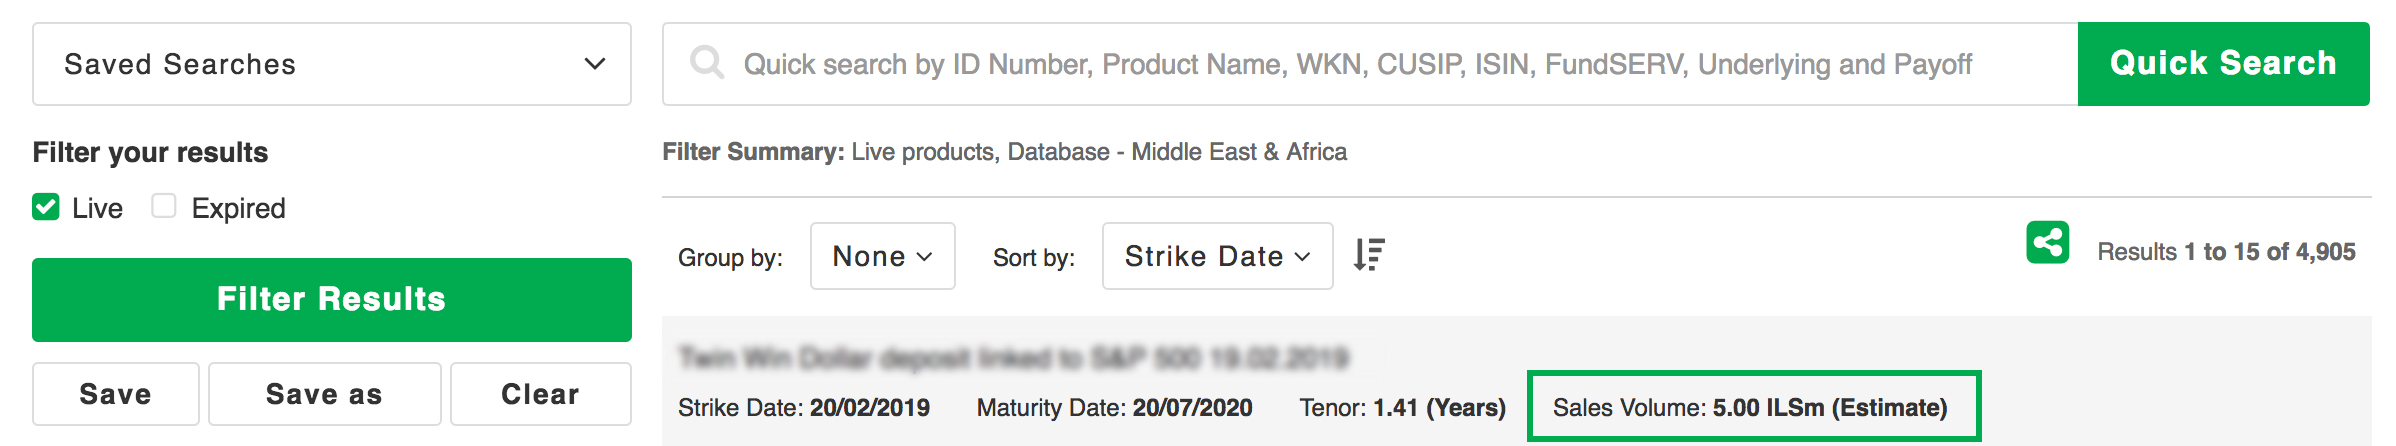
Option to export data
Giving the user an option to export data as a CSV file saved them user hours of copying and pasting whilst giving them the ability to manipulate data within spreadsheets.
Export button added to table
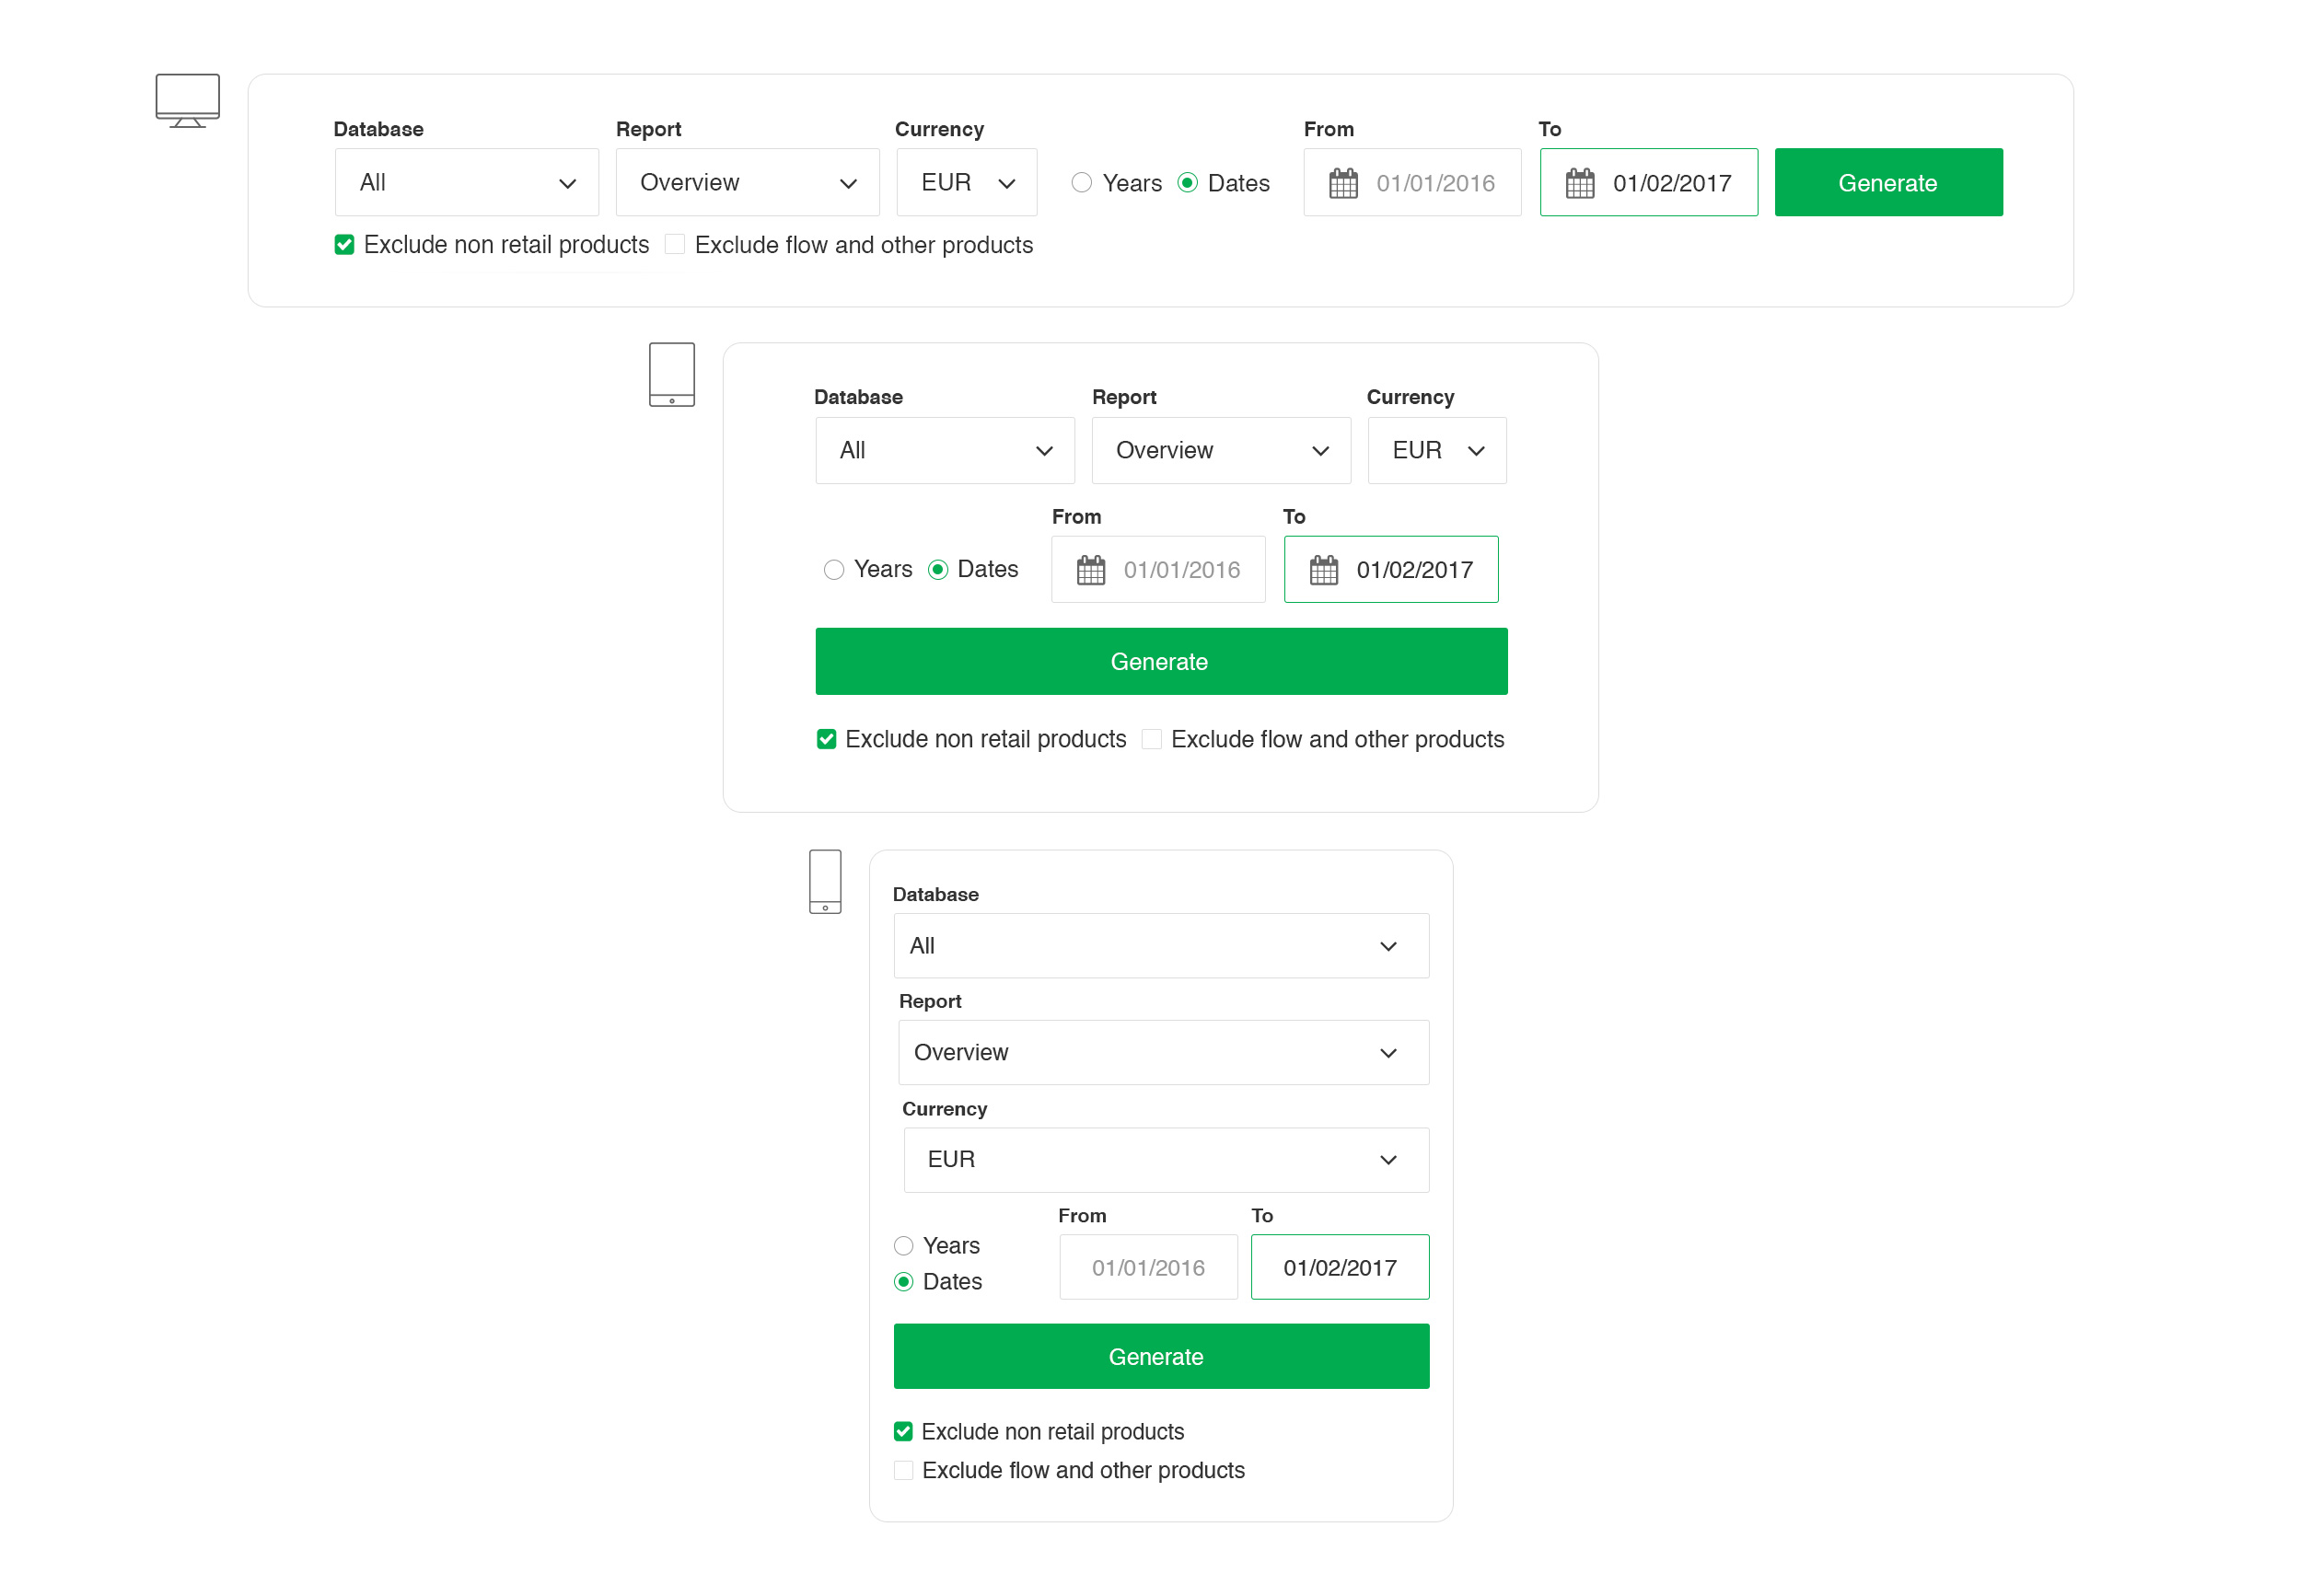
Responsive design
By creating a responive design we gave users the flexibility to search and analyse on multiple devices.
Responsive design snippet for analysis reports
Structuring the data for a more informative experience
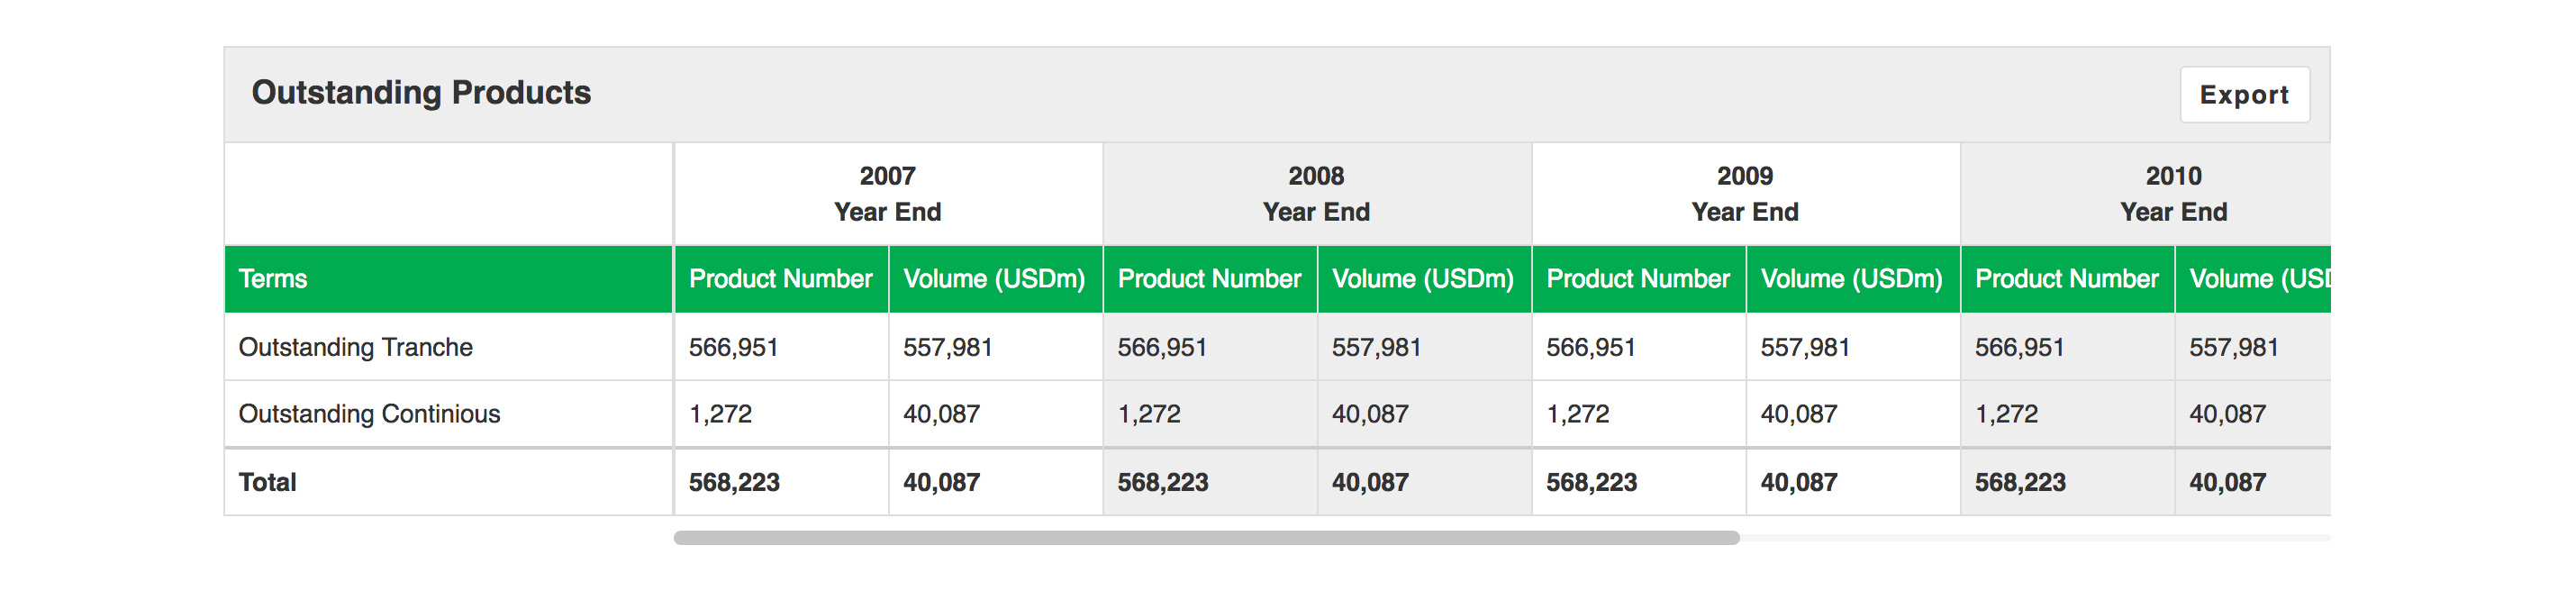
Displaying volume
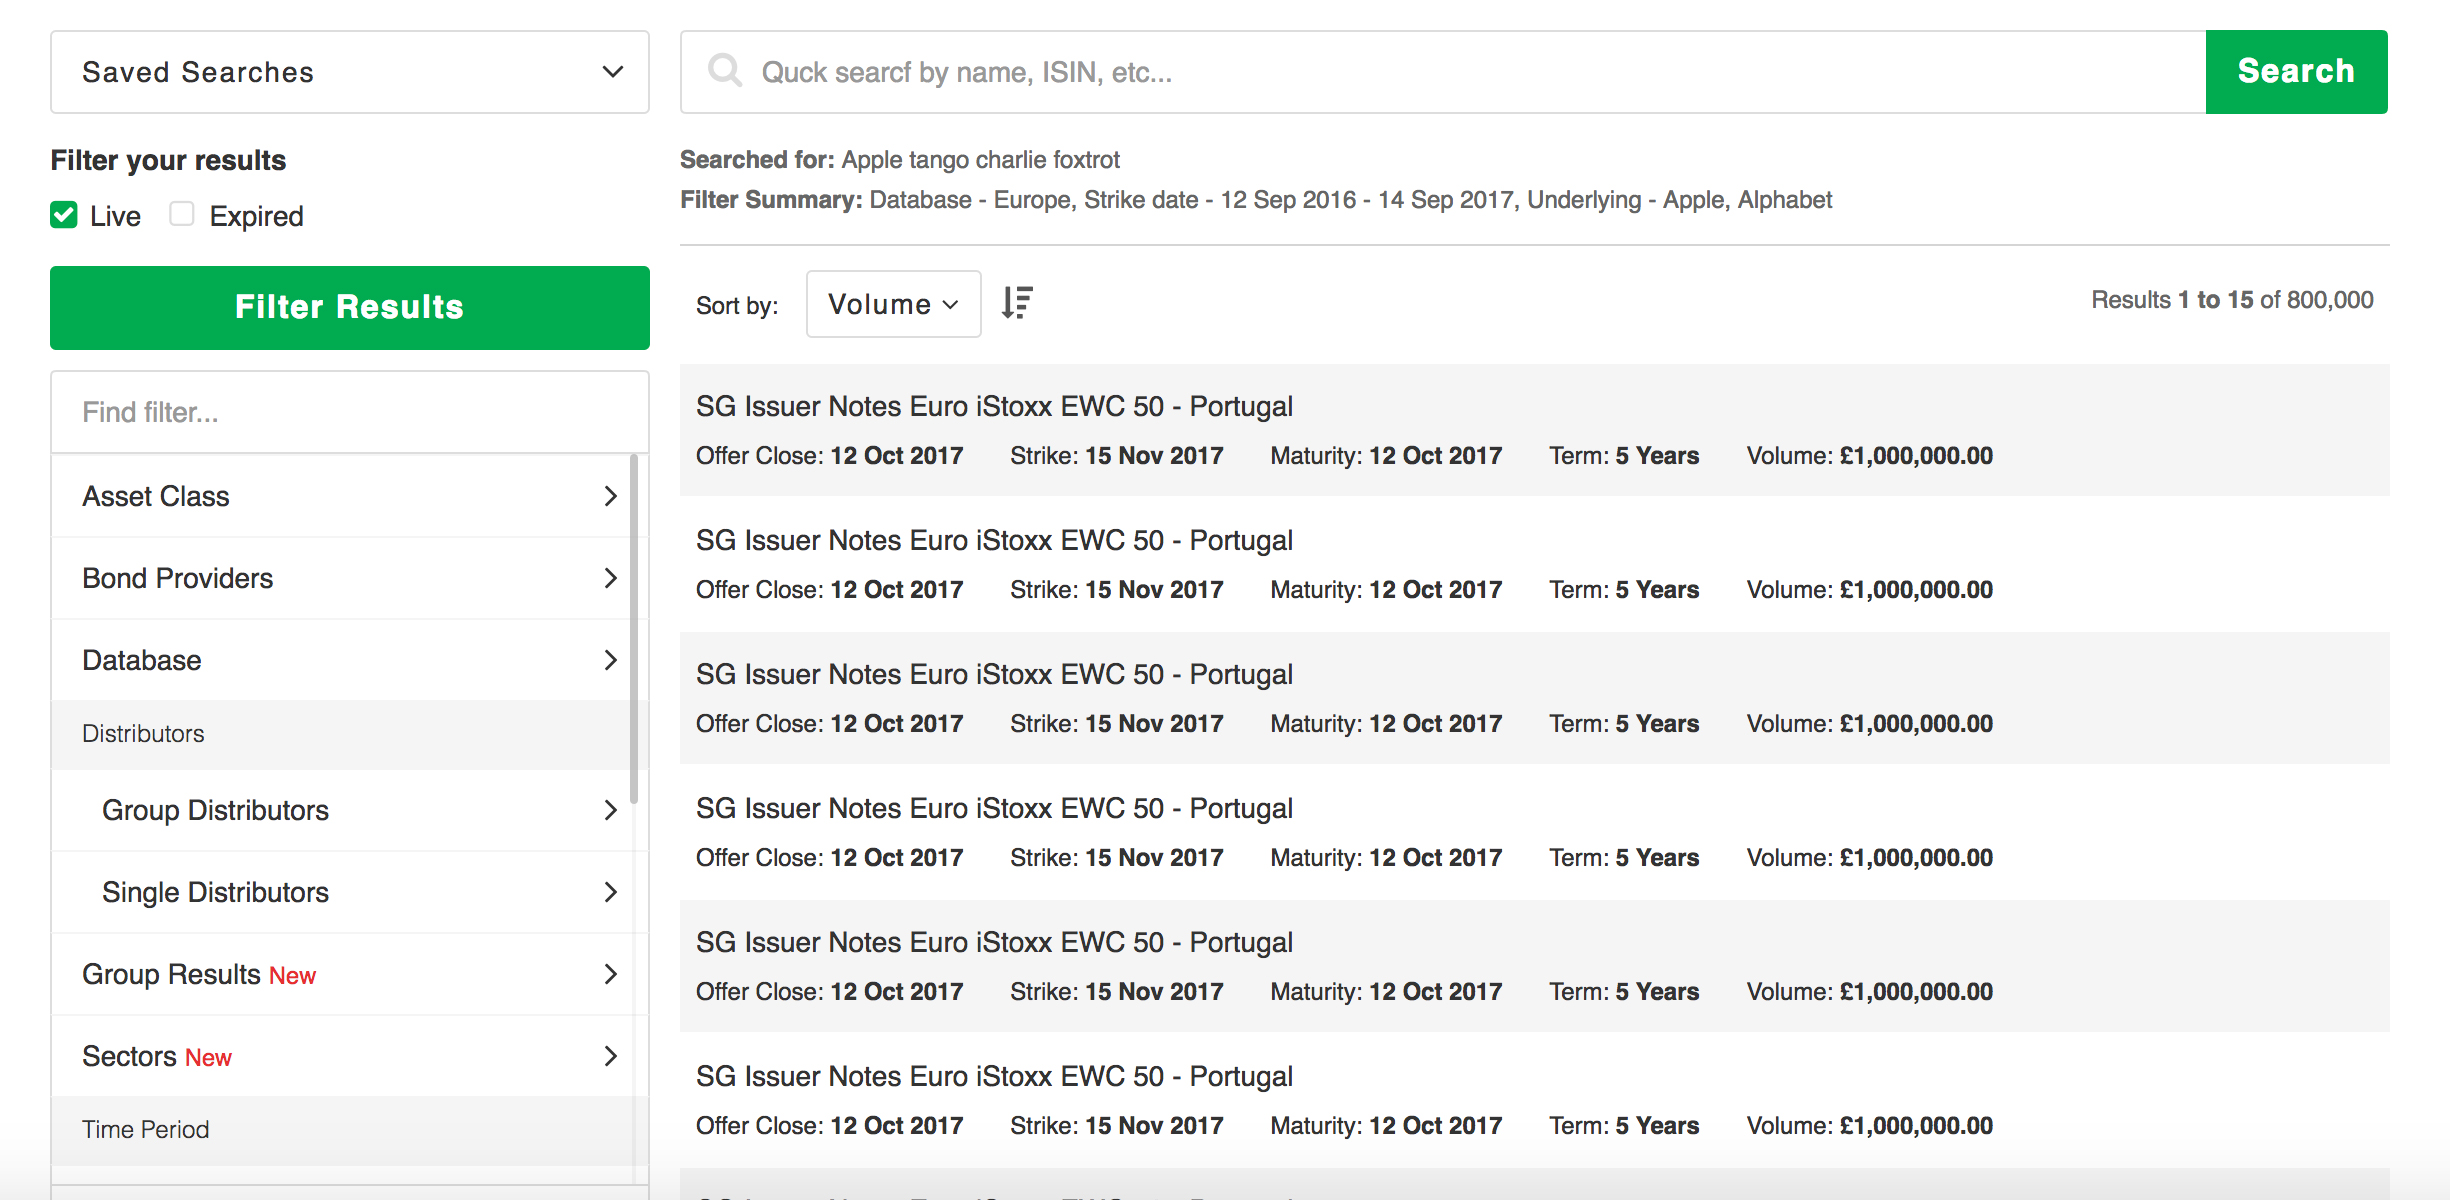
Showing volume on search results and analysis reports, was sought after from users but not possible until now due to technology constraints.
Volume on product summary
Categorisation of product details and filter attributes
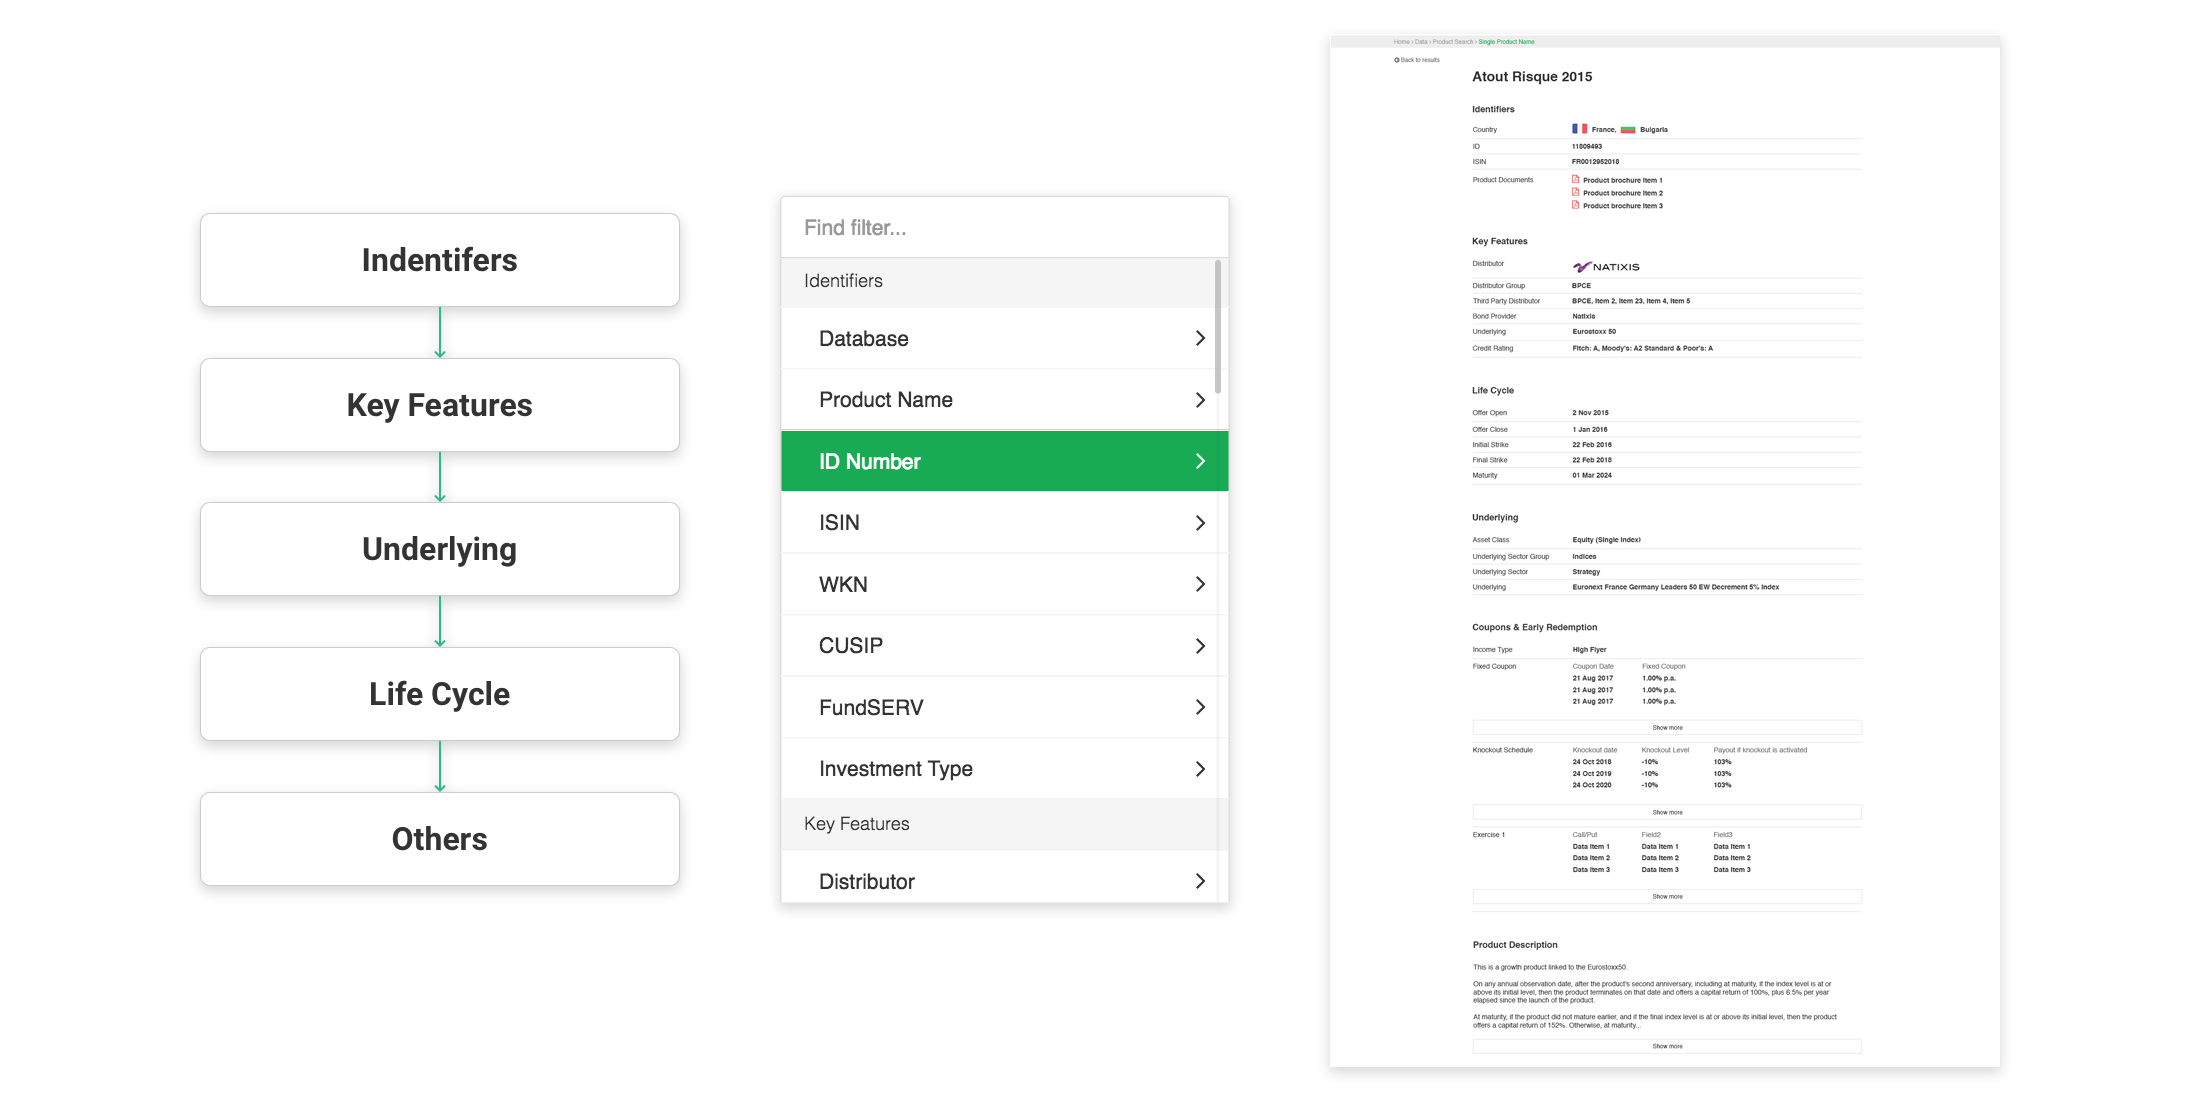
With input from SRP Analysts, a new structure for the product details page was defined. Filters on the search were categorised according to the product details to keep a consistent flow of information.
Categorising Filters and Product Details
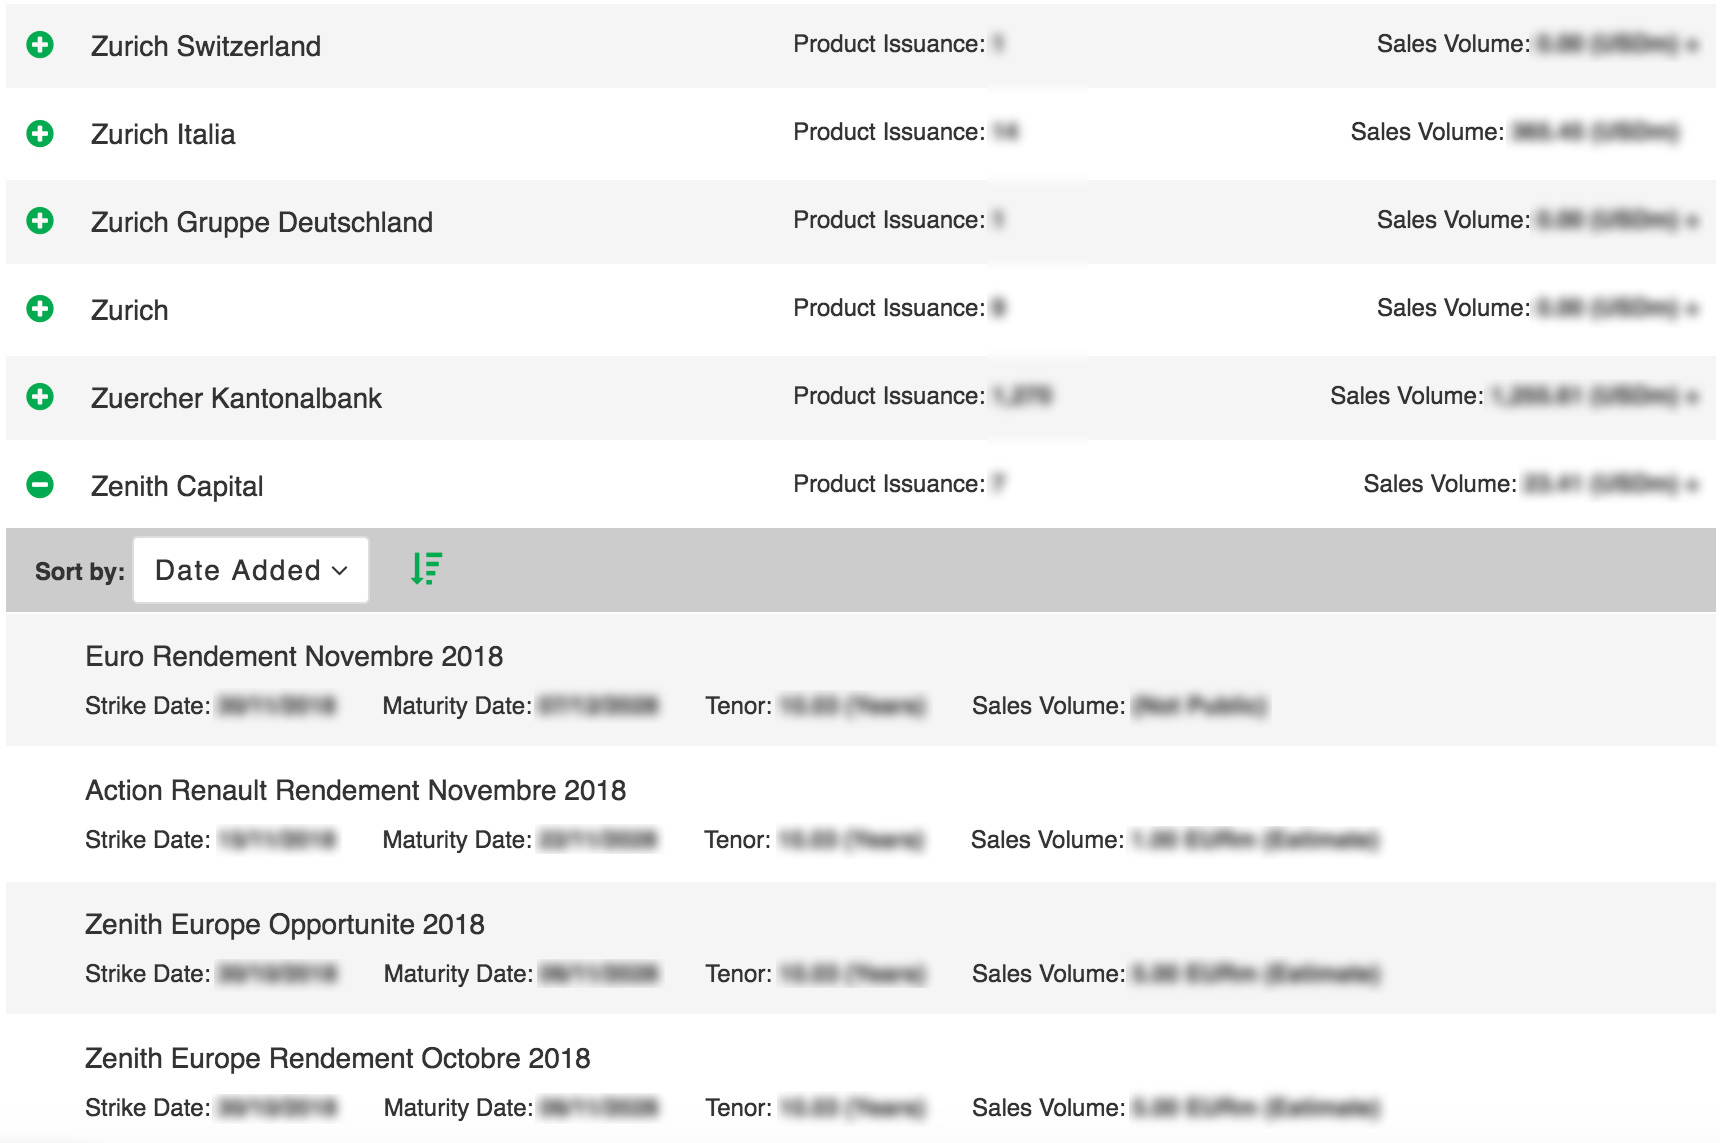
Grouping
Deeper analysis was made easier by grouping products. Now the users could easily see which distributors were selling what products in which regions and much more.
Grouping product results
Testing the assumptions
Testing the assumptions
I was invited to the Structured Products Europe 2018 conference in London to conduct usability tests and unveal the new prototype design.
I tested the prototype with users' who we had initially met alongside a new existing group of subscribers.
The prototype was also showcased to SRP's internal analysts.
Lessons learned

Navigating
Users could easily navigate search and analysis sections from the header.
Quick Search
Users understood it's function from past experience or using other search tools.

Filtering
Users were happily able to browse and selectively choose filtering options.
Users were happily able to browse and selectively choose filtering options.

Grouping
Users found it difficult to locate the grouping filter. Once found, users could grouping results with ease.
Deleting Saved Searches
Some users were unable to delete saved searches. Majority of the users found it confusing can counterintuitive.
Some users were unable to delete saved searches. Majority of the users found it confusing can counterintuitive.
Exporting Data
Users were very appreciative of having the ability to export data with a click
of a button.
Adapting to feedback
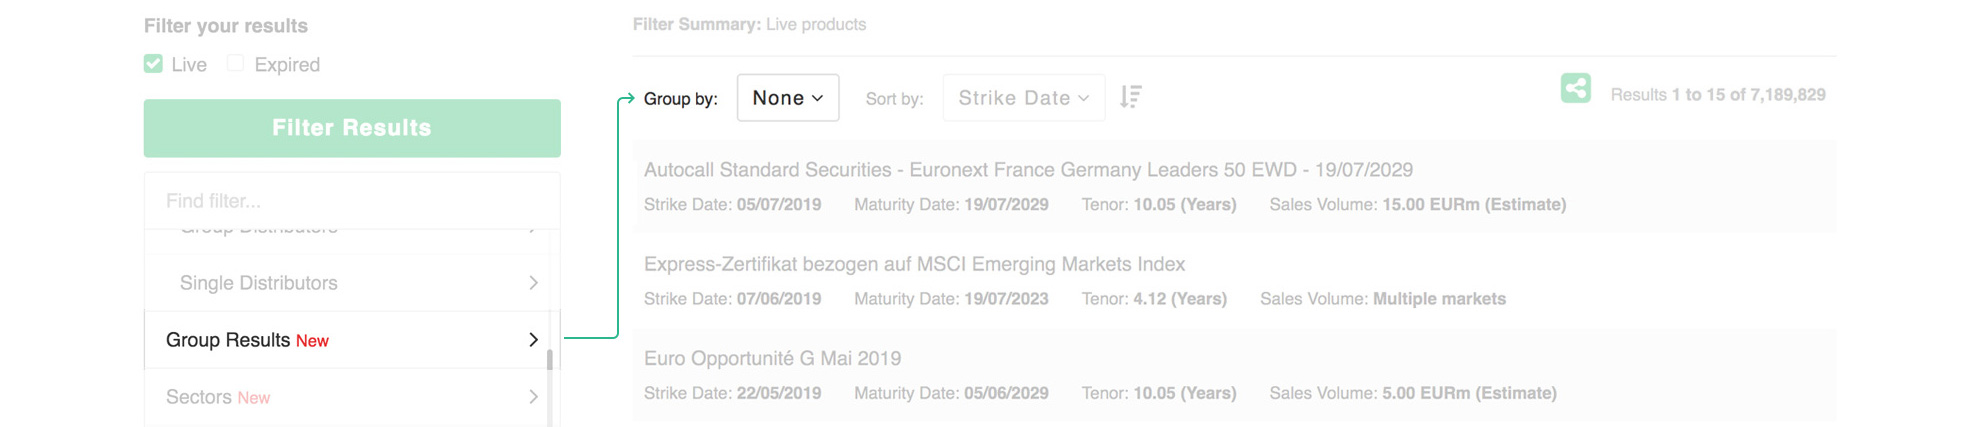
Increasing visibility for grouping products
During the usability tests, users found it difficult to locate the grouping filter. Confusion was caused by it being categorised as a product details filter. The feedback received indicated grouping results was more of an after thought once the product details had been filtered.
During the usability tests, users found it difficult to locate the grouping filter. Confusion was caused by it being categorised as a product details filter. The feedback received indicated grouping results was more of an after thought once the product details had been filtered.
Moving 'grouping' from the filters column, next to 'sort by'
Refining how to delete saved searches
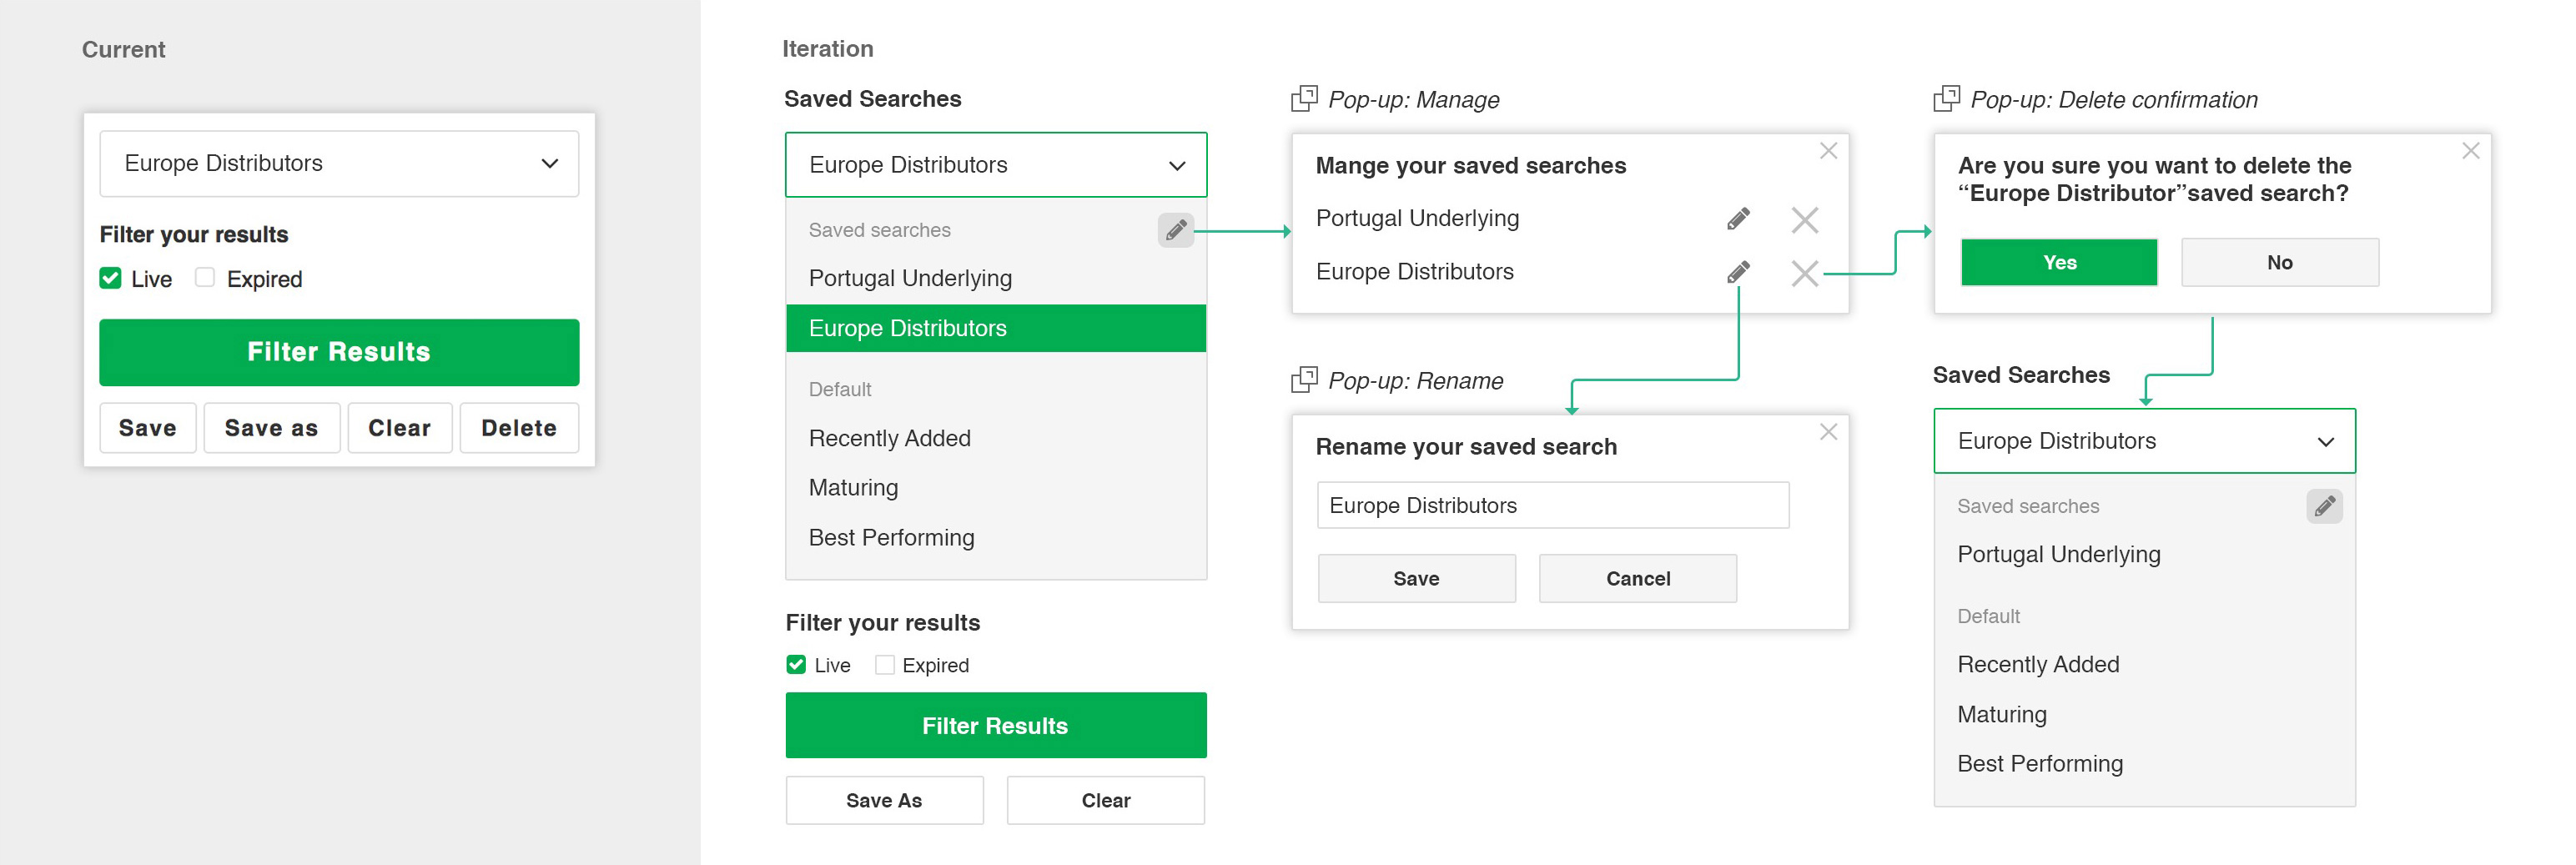
I learned the deleting functionality was counterinutitive and very confusing from the feedback given by the SRP Analysts. A lot of them could not complete the function or when they did, they didn't understand the logic behind it.
Iterative flow for deleting saved searches
Product shots
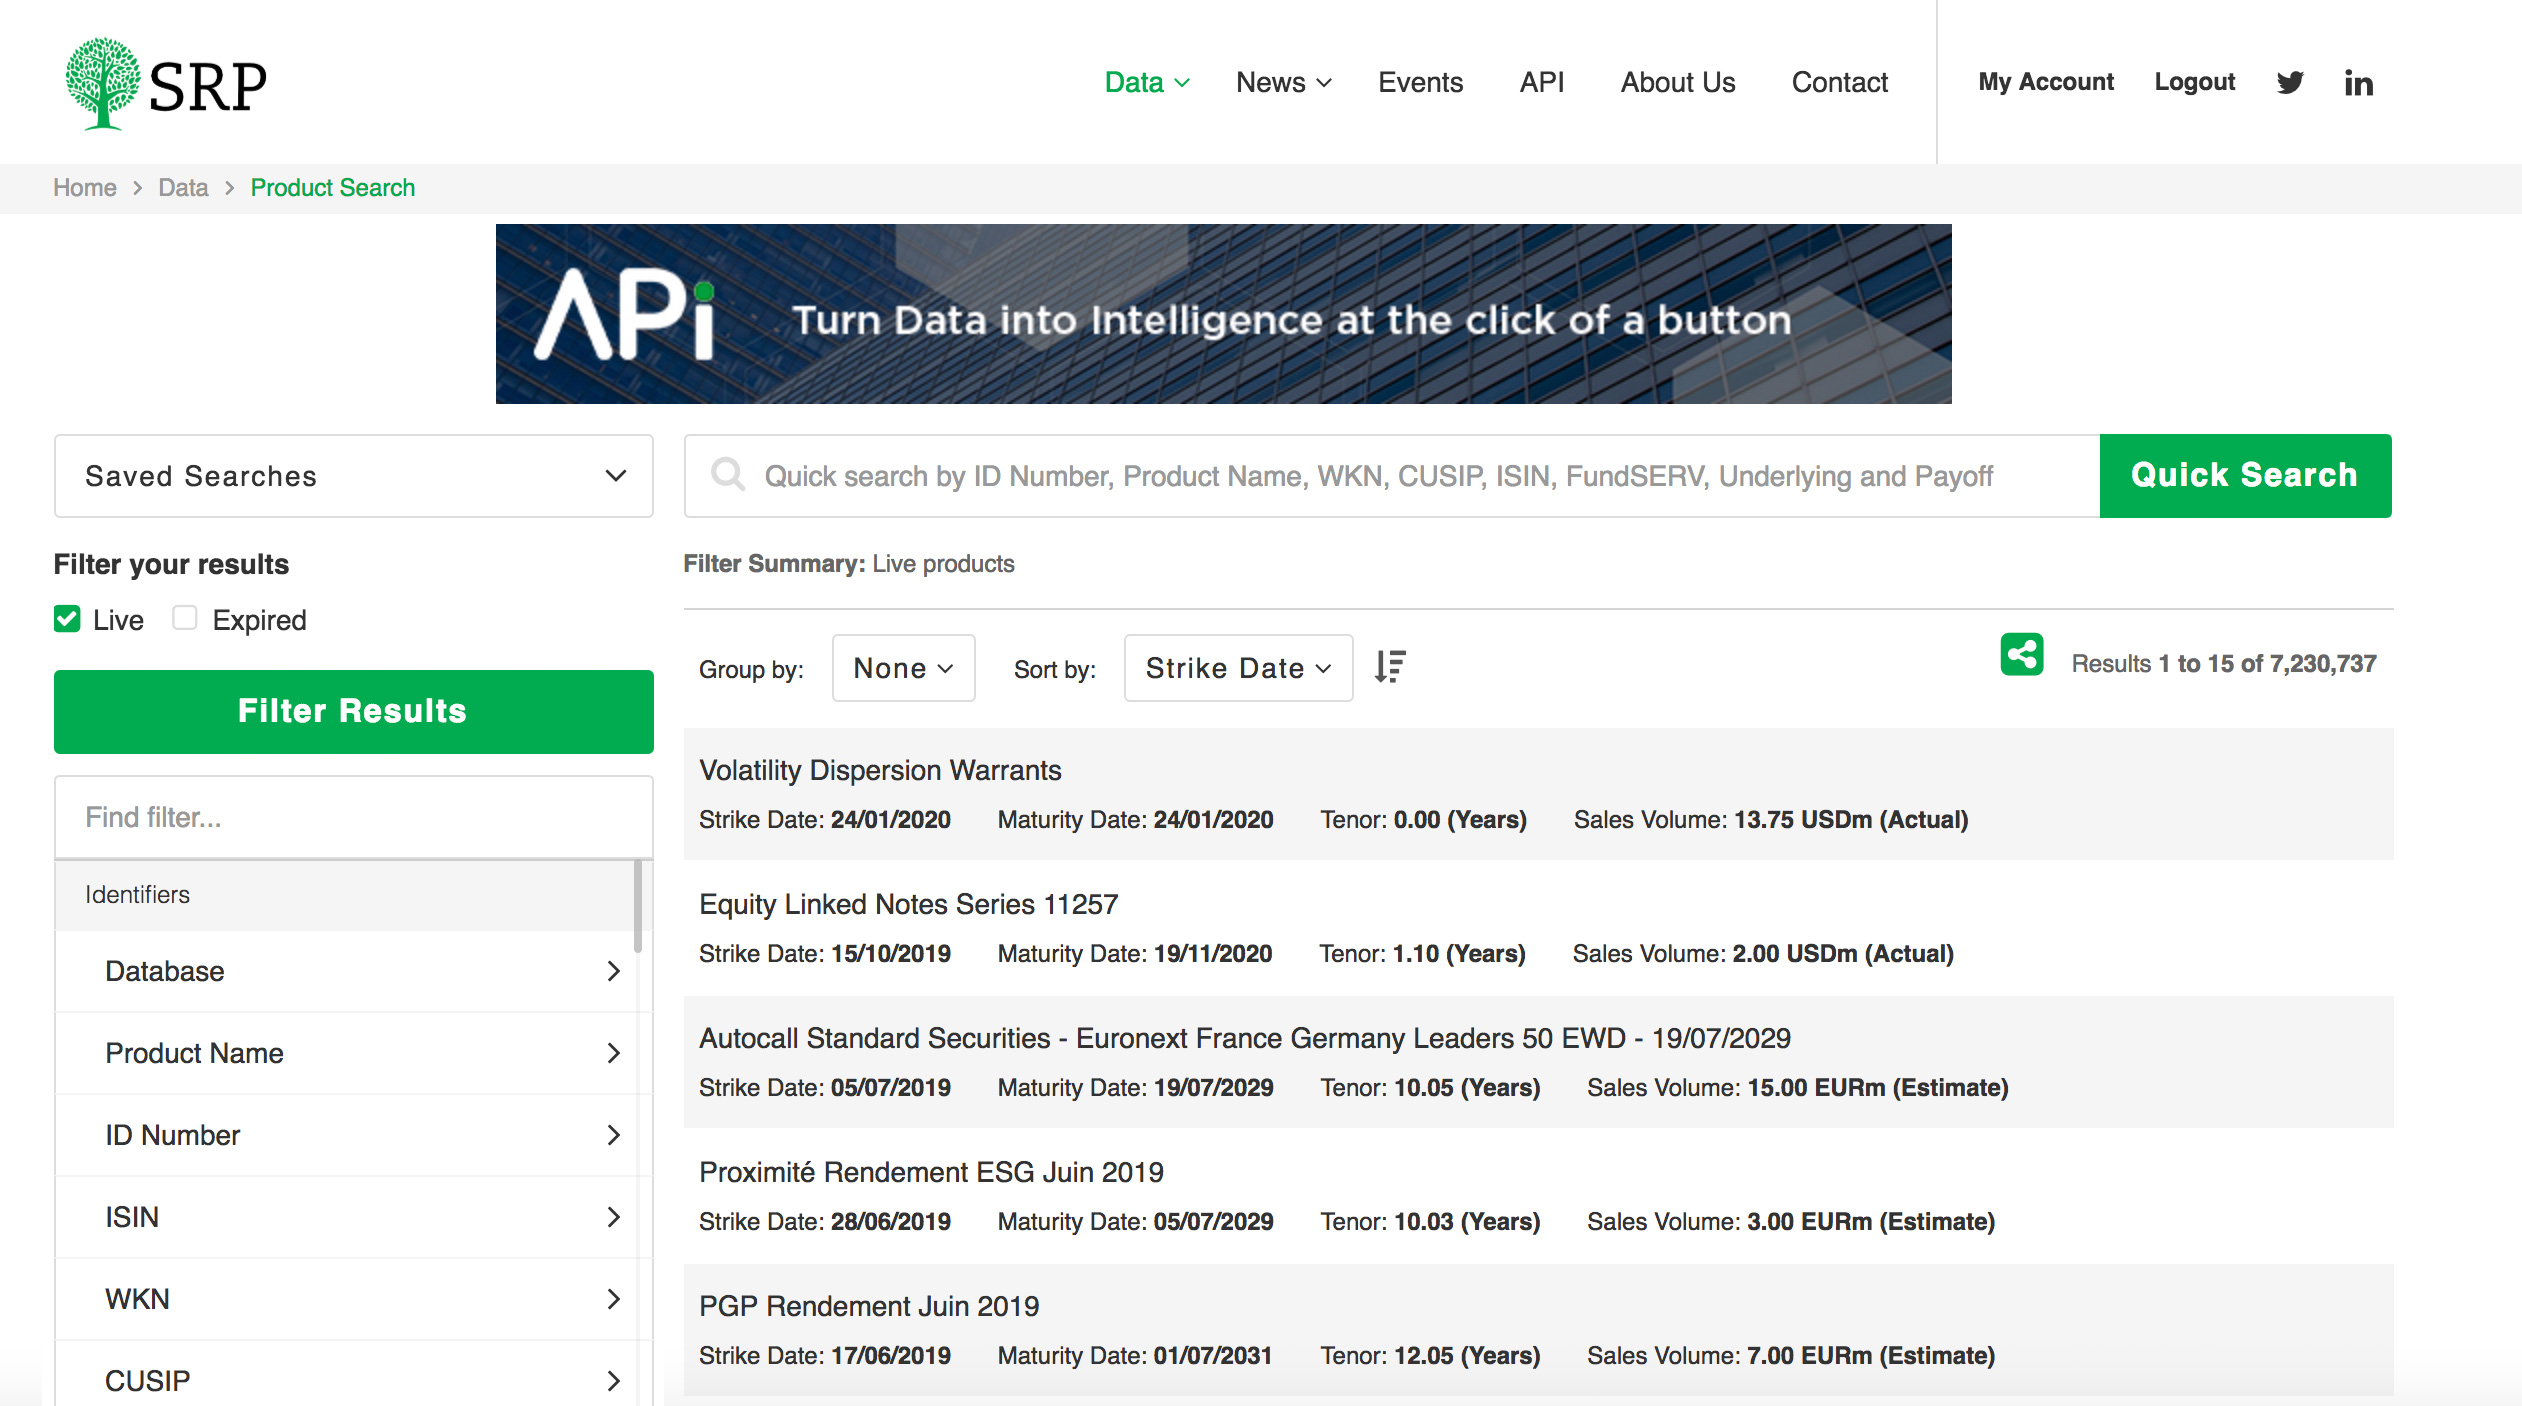
Product Search
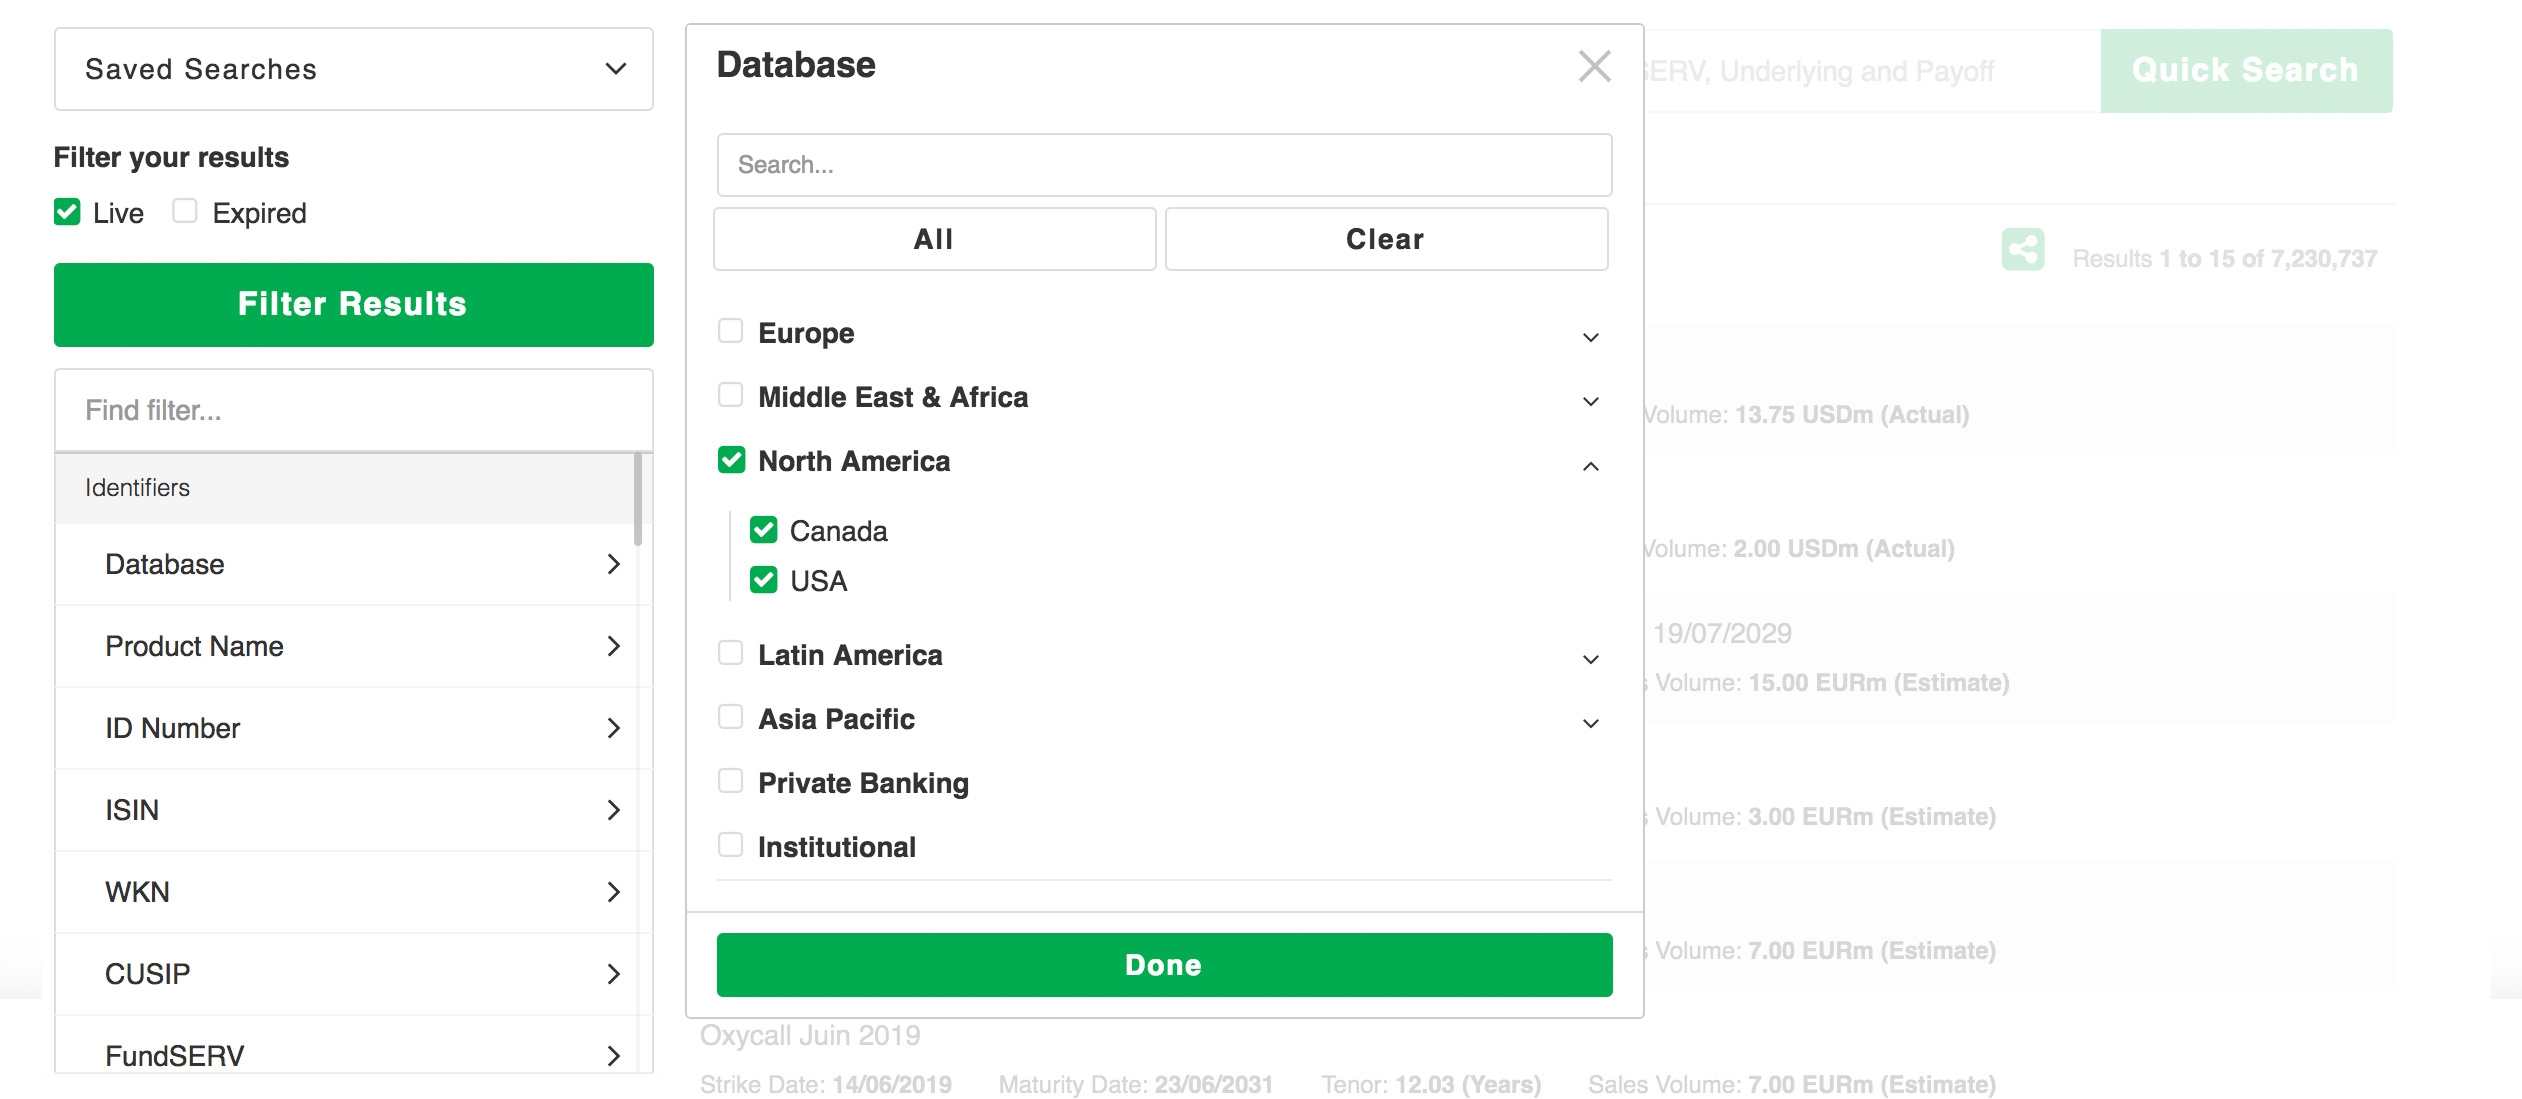
Database Filter on Product Search
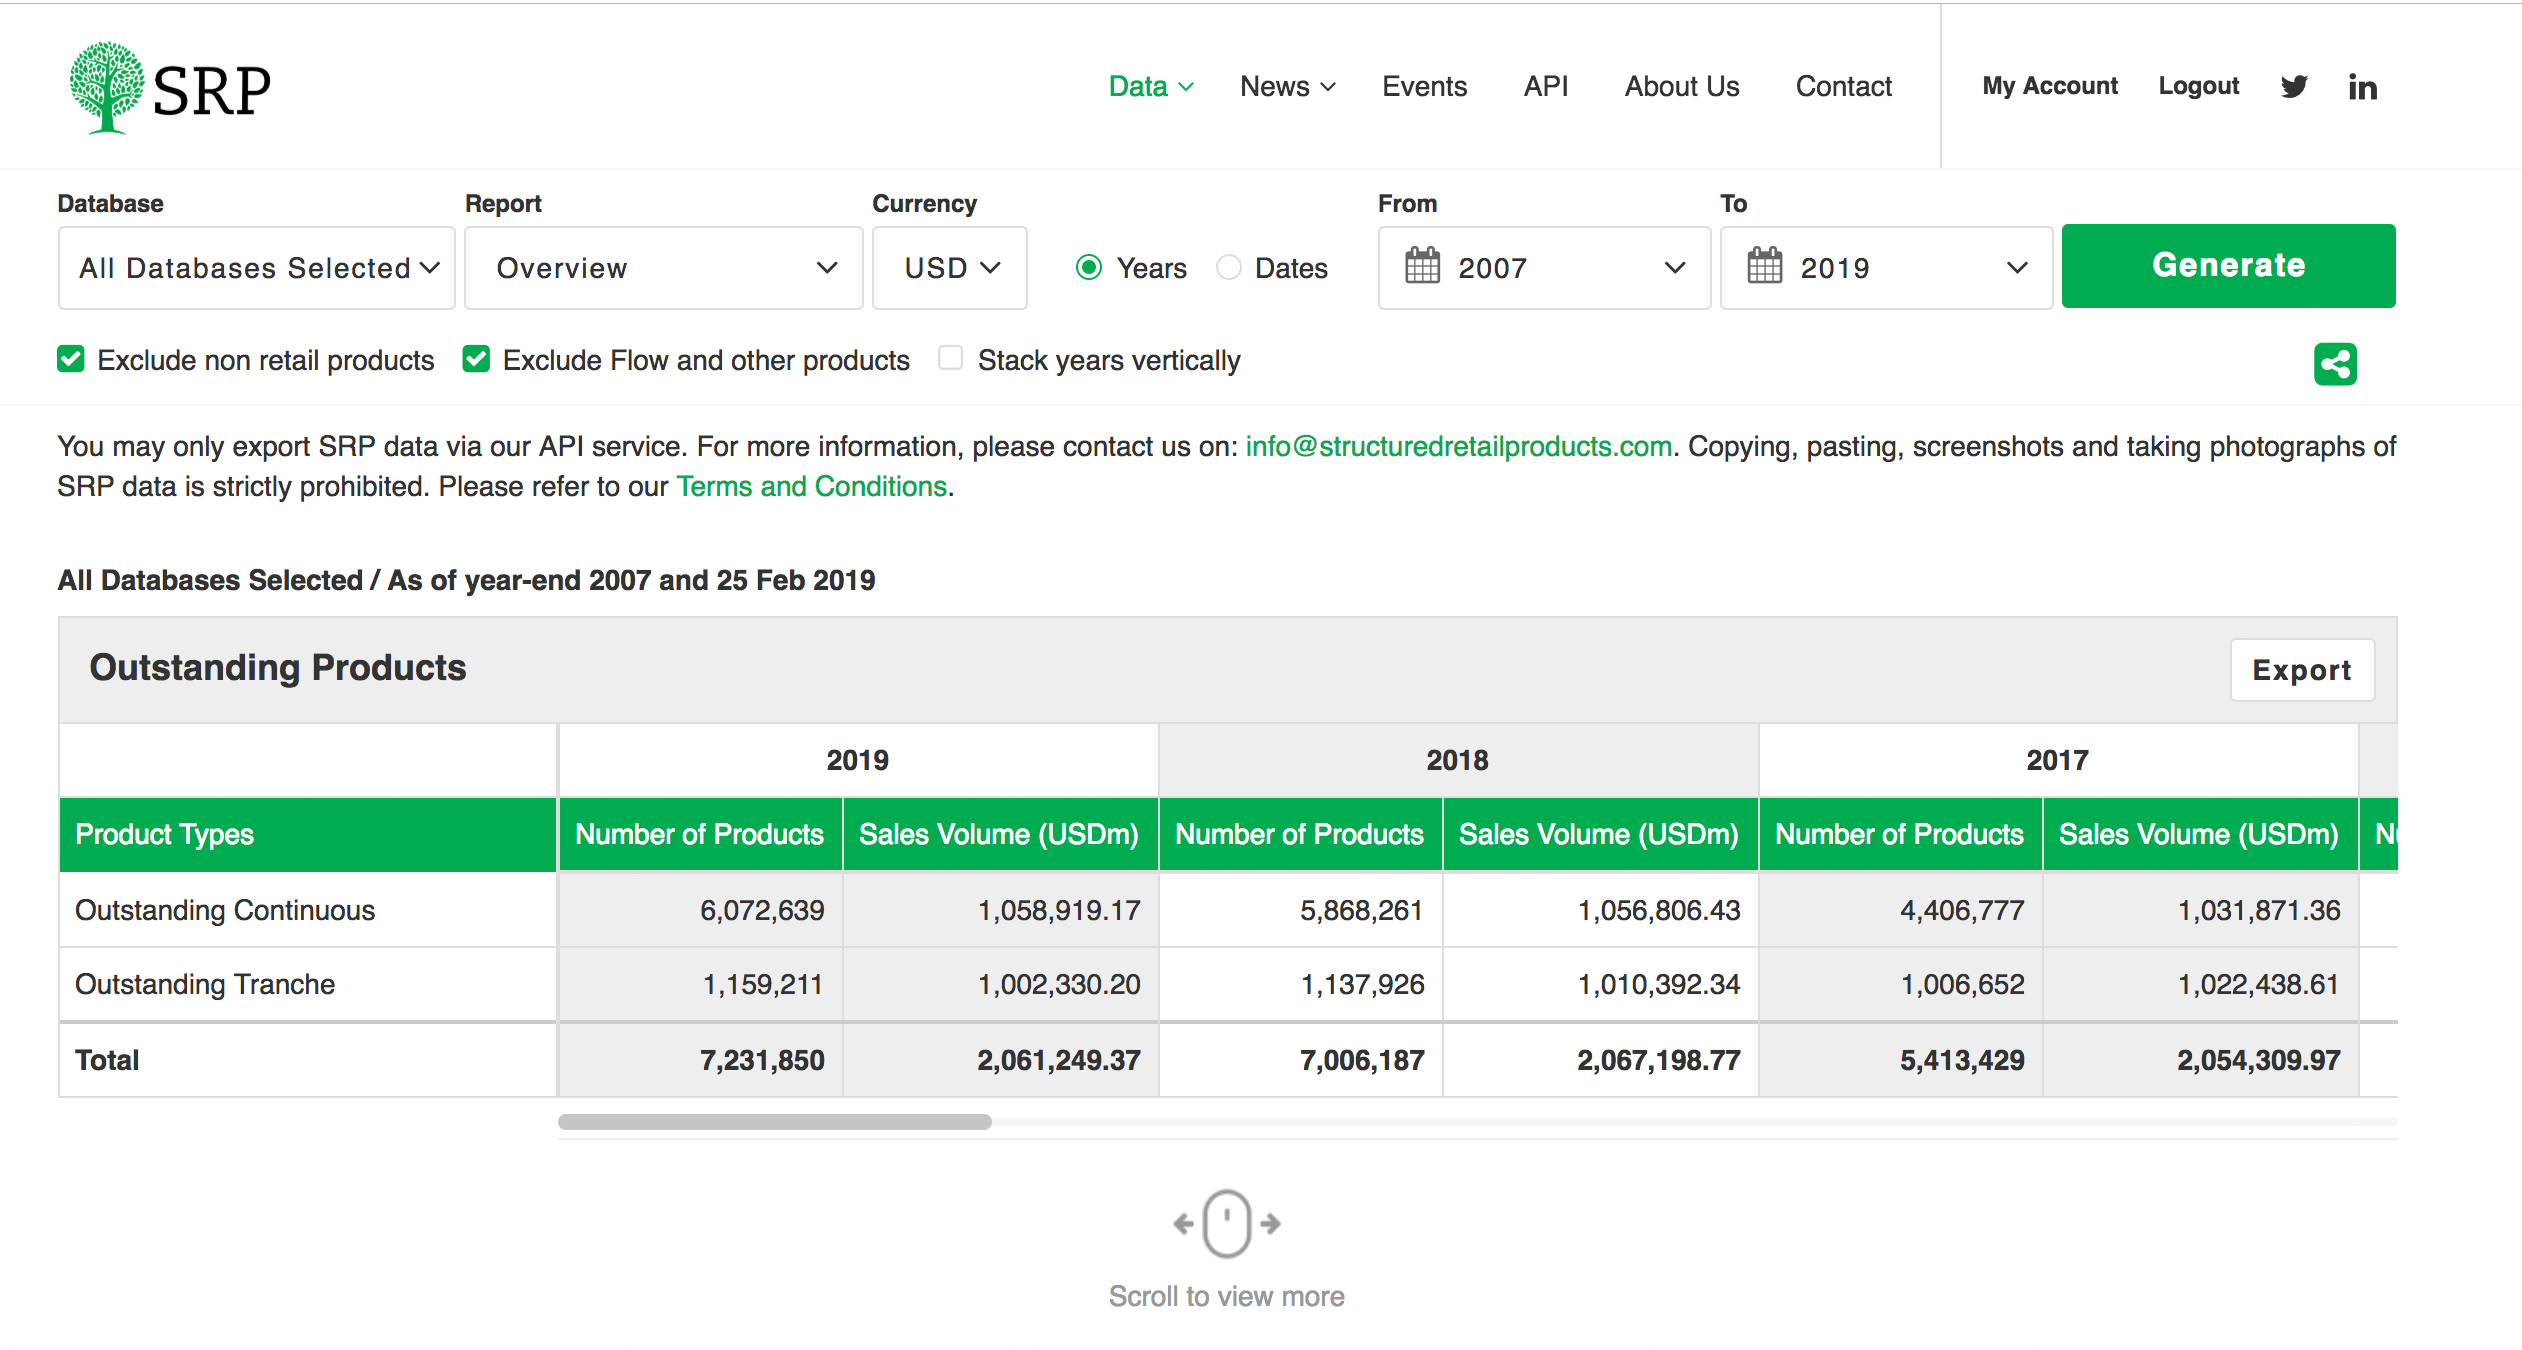
Analysis Overview
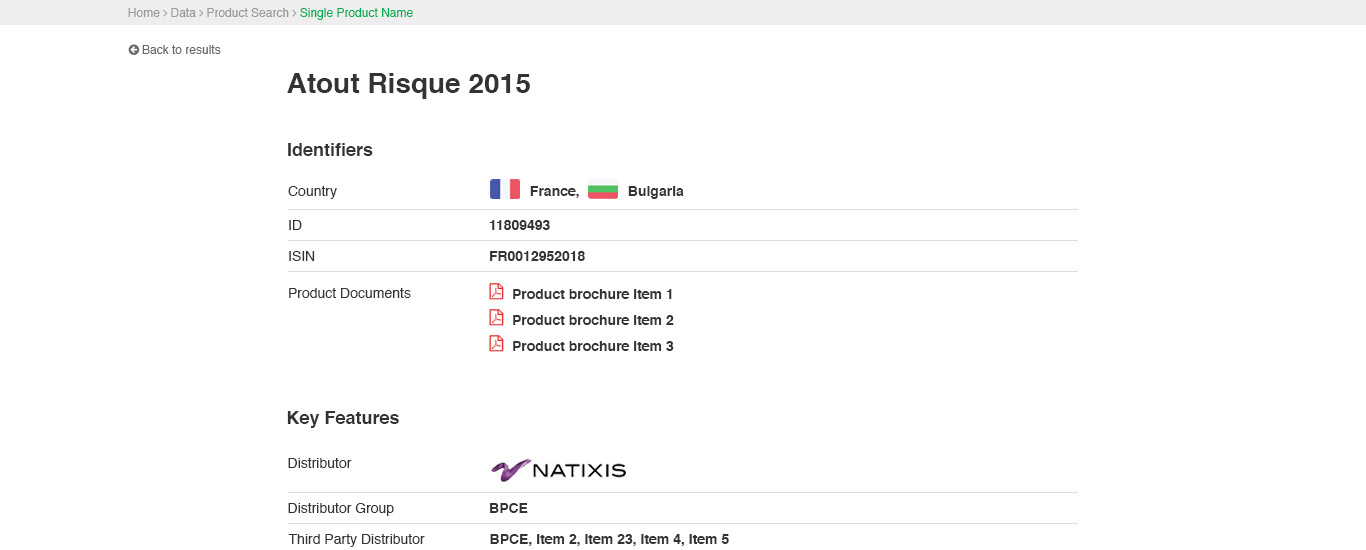
Live - Product Details
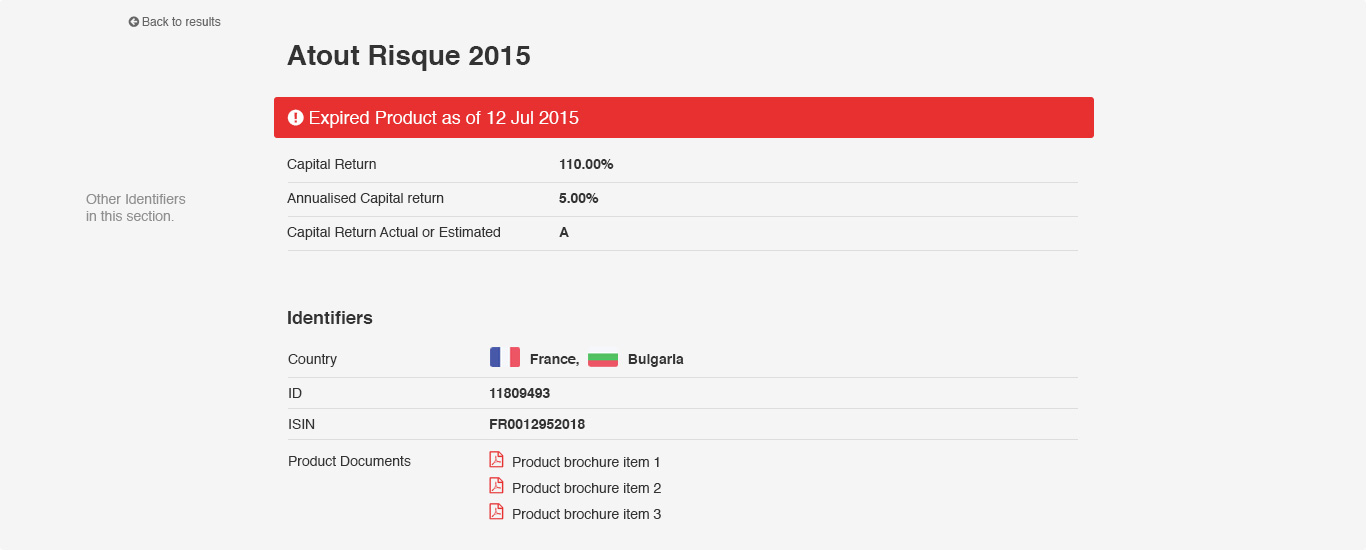
Expired - Product Details
Retrospective
Good communication first...pixel perfection later
I learned it was ok to not spend hours on perfecting designs before presenting to stakeholders, as long as I could communicate my thoughts clearly using a combination of wireframes, UI screens, task flows and microinteractions all depending on the complexity of the task.
The approach helped me get my ideas across easily to stakeholders, pass to the prototyping stage and stick to the deadlines without the pressure of pixel perfect design.
Small details can make big differences
Paying attention to the small nuances and microinteractions in the design helped decrease noise and creating focal points on screen when a user was making choices. Showcasing summaries onchoices users had made created a sense of assurance.
Keep calm when it gets chaotic
Working in a sizeable team and with a variety of professionals there were times where the environment could be highly stressful. I dealt with the pressure by prioritising my workload and dividing tasks into smaller pieces so it wouldn't seem so overwhelming.
Next Steps
SRP is a complex entity that consists of big data, publishing and events. The data section was a big milestone of the project, however more was to come, the next challenges that were awaiting me was to enhance their news and events side of the business.
Project Wins
704% increase in subscriber usage of analysis reports
45% increase in subscriber usage of product search
58% increase in interaction time with product search with a radical decrease in search speeds
Satisfaction from subscribers and internal analysts in their experience of carrying out search queries.
Added value for premium subscribers with the ability to export analysis reports.

© 2025 SALIM RUPAWALA. ALL RIGHTS RESERVED.